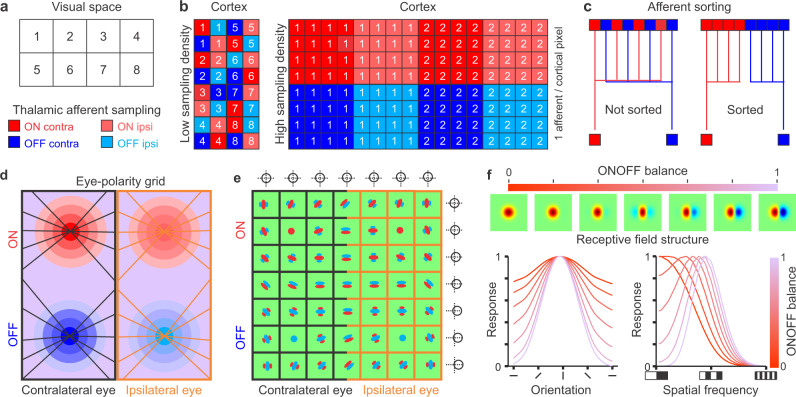
Fig. 1. Theory of cortical map formation.
a Cartoon illustrating 8 adjacent positions in visual space that can be discriminated as separate by visual cortex (e.g. two stimuli are perceived as separate only if they fall in different squares). The theory assumes that each square position is sampled by four different types of thalamic afferents that signal the onset of light (ON: red) or dark stimuli (OFF: blue) projected on the contralateral (contra: high contrast) or ipsilateral retina (ipsi: low contrast). The size of the squares represents the visual resolution (receptive field size) of the thalamic afferents. b Cartoon illustrating a small cortex sampling each spatial position with four afferents (left) and a larger cortex sampling each spatial position with 64 afferents (right). c Cartoon illustrating the afferent sorting. d The theory assumes that the visual cortex sorts afferents with overlapping receptive fields by eye input and contrast polarity, forming an eye-polarity grid with separate regions for ON-contra, OFF-contra, ON-ipsi, and OFF-ipsi afferents that are linked by iso-orientation lines. e This afferent sorting makes cortical receptive fields become dominated by eye input and ONOFF polarity. Because afferents with different eye input are better matched in retinotopy than afferents with different polarity, retinotopy changes slower with cortical distance across the eye than ONOFF polarity border (circles and crosslines at panel outer borders illustrate changes in receptive field position). f The theory predicts that increases in ONOFF response balance are associated with increases in stimulus selectivity. The top panel shows an increase in ONOFF response balance from ON dominated to equal ON and OFF subregion strength. The bottom panel illustrates how the increase in ONOFF response balance increases orientation selectivity (left), bandpass tuning and spatial resolution (right).

