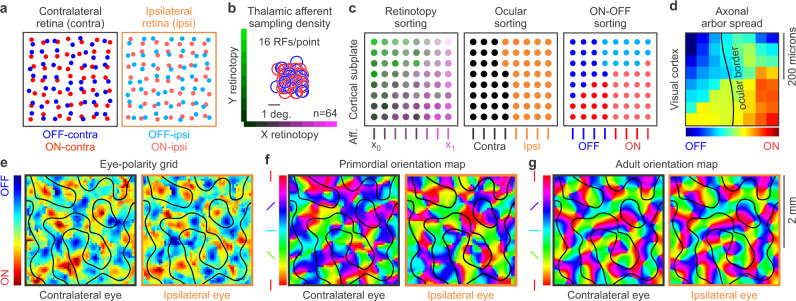
Fig. 2. Main stages of the computational model.
a Retinal development. Model simulations of ON and OFF retinal ganglion cells (red and blue circles) from the contralateral and ipsilateral eyes (high and low contrast). b Receptive fields (RF) of 64 thalamic afferents receiving input from the retinas illustrated in a and thalamic afferent sampling density (16 receptive fields sampling the same visual point). c Model simulations of the afferent sorting in the cortical subplate. The 64 afferents (Aff.) illustrated in b are sorted first by retinotopy (left), then by eye input (middle) and then by ONOFF polarity (right). d Model simulations of the eye-polarity grid after the afferent axon arbors spread and combine in each cortical pixel (red: ON dominated, blue: OFF dominated, black line: border between regions dominated by contralateral and ipsilateral eyes). e Model simulations of the eye-polarity grid in a larger cortical patch. f Primordial orientation maps for the contralateral (left) and ipsilateral eyes (right) resulting from thalamocortical convergence. g Adult orientation map after the primordial map is optimized by visual experience.

