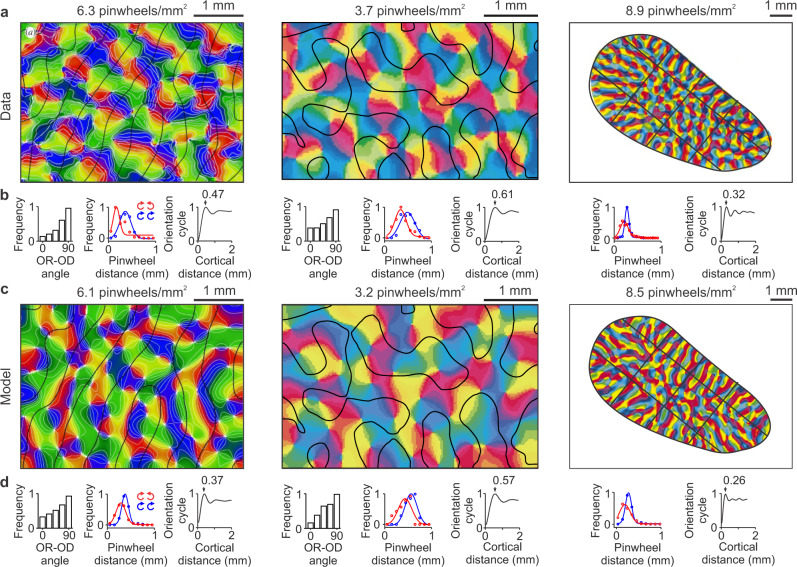
Fig. 7. Model simulations of cortical orientation maps in three different species.
a Maps of stimulus orientation and pinwheel density experimentally measured in the visual cortex of a macaque (left), a cat (middle) and a tree shrew (right). Reproduced with permission from Horton and Adams, 2005 (original data from Blasdel, 1992), Hubener et al., 1997, and Bosking et al., 1997. The black lines illustrate ocular dominance borders in the macaque and cat visual cortex and iso-retinotopic lines in the tree shrew. b Statistics of the three orientation maps from (a) showing, for each animal, from left to right, distribution of angles between iso-orientation lines and ocular-dominance borders (in macaque and cat, tree shrews do not have ocular dominance borders), distance between pinwheels with same (blue) or opposite (red) rotations, and orientation map periodicity. c–d Model simulations of the experimental data from (a–b) (using the same color map as the published data). Source data are provided as a Source Data file.

