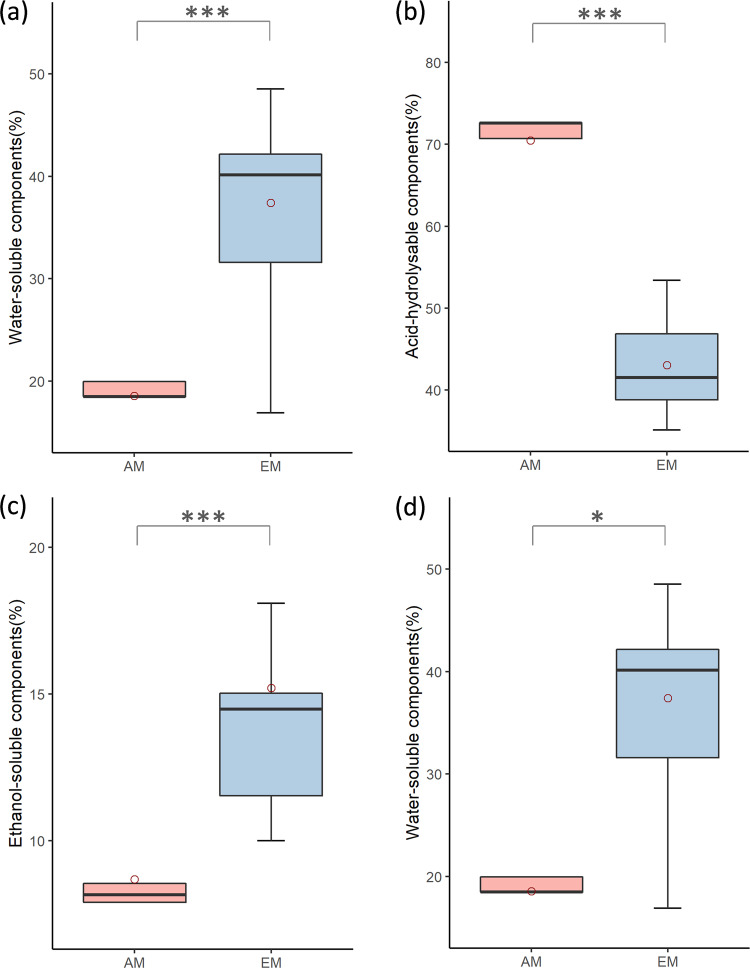
Fig. 3. Boxplots of WAEN components in AM and EM fungi.
a Water-soluble components, P < 0.001, b Acid- hydrolysable components, P < 0.001, c Ethanol-soluble components, P < 0.001, d Non-extractable components, P < 0.05. All P values refer to the Mann–Whitney test, AM (n = 4) and EM (n = 11). Upper and lower limits of the box- quartiles around the weighted-mean, horizontal lines within boxes- weighted-median values within each mycorrhiza group, and red circles - weighted-mean of each mycorrhiza group.

