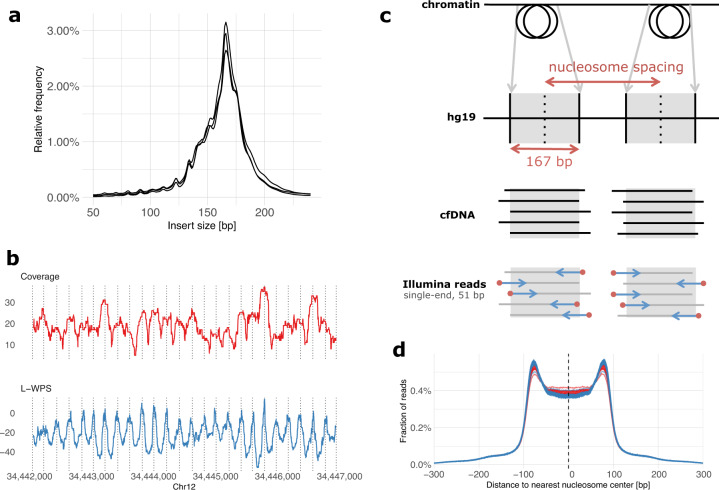
Fig. 1. Nucleosome footprint in paired-end and single-end cfDNA sequencing data.
a The insert size distributions of three plasma samples sequenced at high coverage using paired-end sequencing data shows fragment lengths centered on the size of nucleosome-bound DNA. b Coverage and L-WPS score (as defined by Snyder et al.11; same genomic region is displayed) based on paired-end sequencing data of one plasma sample, illustrating specific positioning of nucleosomes and their footprint in plasma cfDNA. c In single-end sequencing data, it is expected that mapped reads will tend to start (red dots) at the boundaries of nucleosomes. d When constructing a genome-wide distribution of the distances between all read start positions and the centers of the nearest expected nucleosomes as derived from a reference experiment in healthy individuals11, the result is an M-shaped distribution with an enrichment of read starts at the edges of nucleosomes and a depletion at the centers of nucleosomes. The distributions shown here are derived from cfDNA samples of 125 healthy individuals and 43 patients with relapsed HGSOC, shown in blue and red respectively. Compared to healthy individuals (blue), plasma samples of relapsed HGSOC patients (red) show a reduced enrichment of read starts at the nucleosome edges and a reduced depletion at nucleosome centers.

