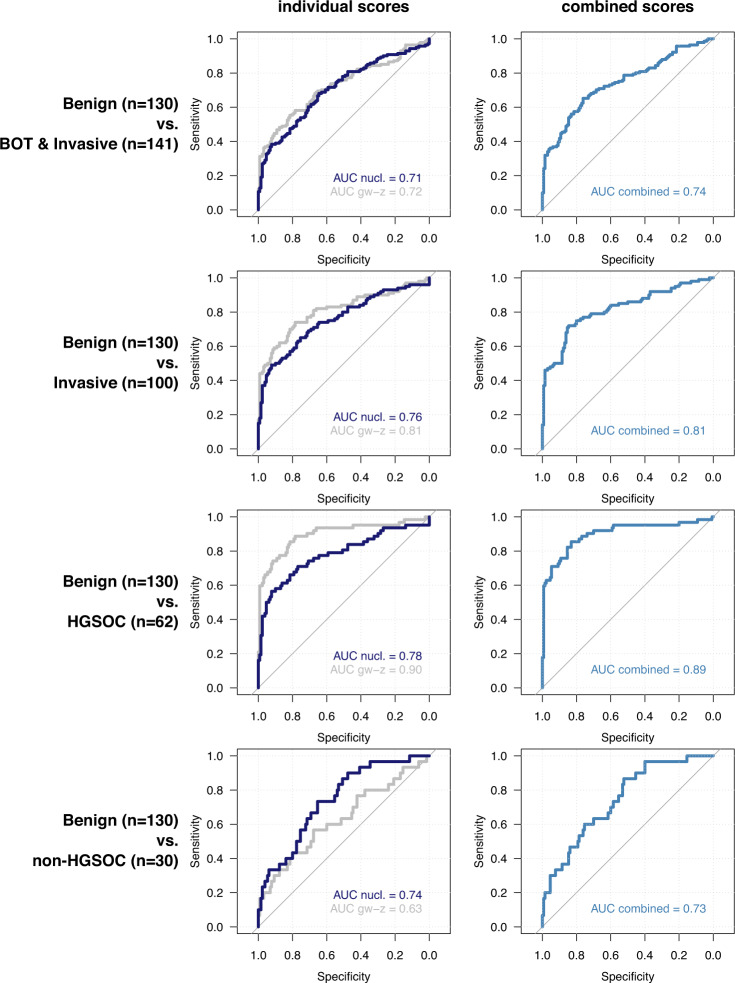
Fig. 3. ROC analysis.
ROC curves for nucleosome scores (“nucl.”) and genome-wide z-scores (“gw-z”) to discriminate patients with benign ovarian disease (n = 130) from patients with borderline (BOT) and invasive carcinoma (n = 141, including 8 patients with metastases; first row); patients with invasive carcinoma (n = 100; second row); patients with HGSOC disease (n = 62; third row); patients with non-HGSOC disease (n = 30; fourth row). ROC curves for nucleosome and genome-wide z-scores were then combined in a single predictor and the optimism-corrected AUC value was calculated (second column).

