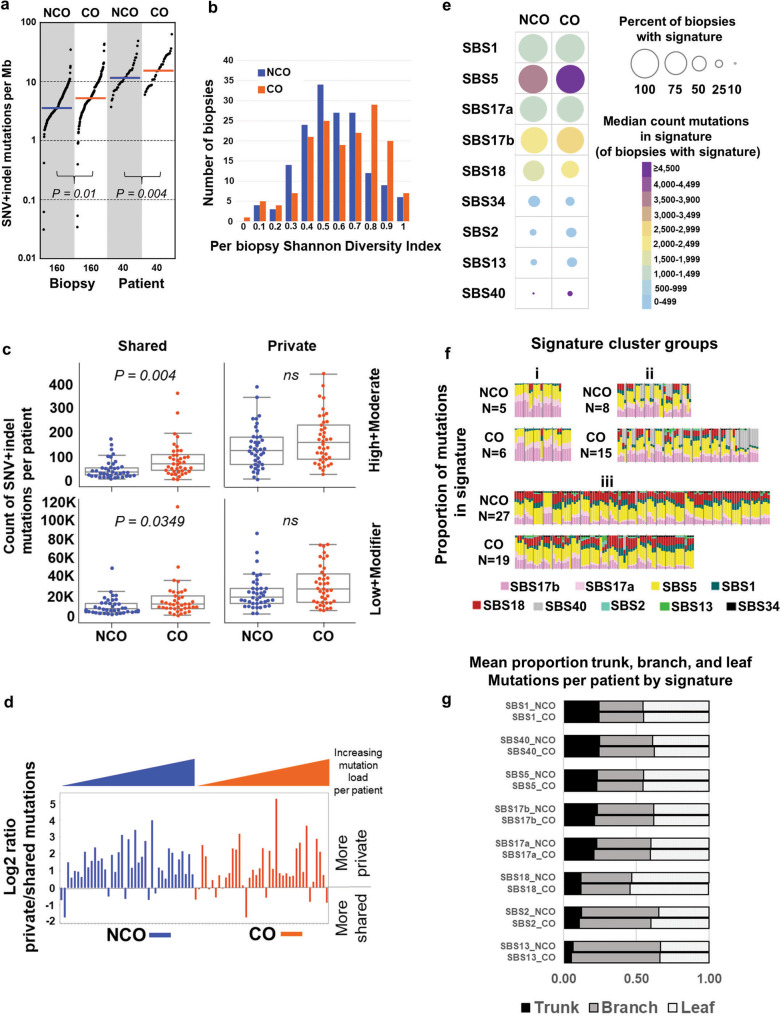
Fig. 2. Highly mutated clones arise and expand prior to clinical detection of BE.
a y-axis (log scale) shows unique SNV + indel mutations per megabase (2,800 Mb of sequence) per biopsy and per patient in NCO and CO. Per patient mutation burden was derived from the sum of unique SNV and indel mutations across four biopsies. Horizontal bar is median (3.56 vs. 5.21 by biopsy, and 11.62 vs. 15.35 by patient, in NCO and CO, respectively). Nine biopsies with exceptionally low mutation load were also included (Supplementary Data File 5, See “Anomalous biopsies” in Supplementary Methods). b Mutational diversity per biopsy using Shannon Diversity Index based on SNV + indel load and VAF in NCO patients (blue) and CO patients (orange). c Count of unique SNV and indel mutations per patient classified as shared between biopsies (left) or private to a single biopsy (right), with “functional” (high or moderate) impact on protein function based on snpEFF92 (top) vs. low or modifier (bottom) (comparison by t-test), (Supplementary Data File 6). Box centerline indicates median, box edges 1st and 3rd quartiles and whiskers 1.5x interquartile range (IQR), all data points outside of IQR were plotted. A total of 40 CO (160 biopsies) and 40 NCO (160 biopsies) patients were examined. Mann–Whitney U test was used for comparison of the two groups. d Log2 ratio of private/shared SNV and indel mutations by patient. Patients with more mutations private to single biopsies than shared between two or more biopsies have values above zero; those with more shared mutations than private have values below zero. e Percent of biopsies with mutation signatures (circle size) and median number of mutations per biopsy in each signature, including only biopsies in which that signature was detected (color scale). SBS3 not shown(only detected in a single CO biopsy). f, Signature cluster groups where each column is a single biopsy. Biopsies are grouped by patient and ordered by patient ID. N = count of NCO or CO patients in each signature cluster. Comparison by Fisher’s exact test. g Signature probabilities were assigned to each mutation, mutations were binned as trunk (shared by all four biopsies per patient), branch (shared by 2 or 3), or leaf (private to a single biopsy), and the mean proportion of mutations in trunk, branch, or leaf for each signature per patient was calculated. SBS3 and SBS34 not shown (very low mutation counts), see Supplementary Data File 10. Source data are indicated in Figure Source Data File.

