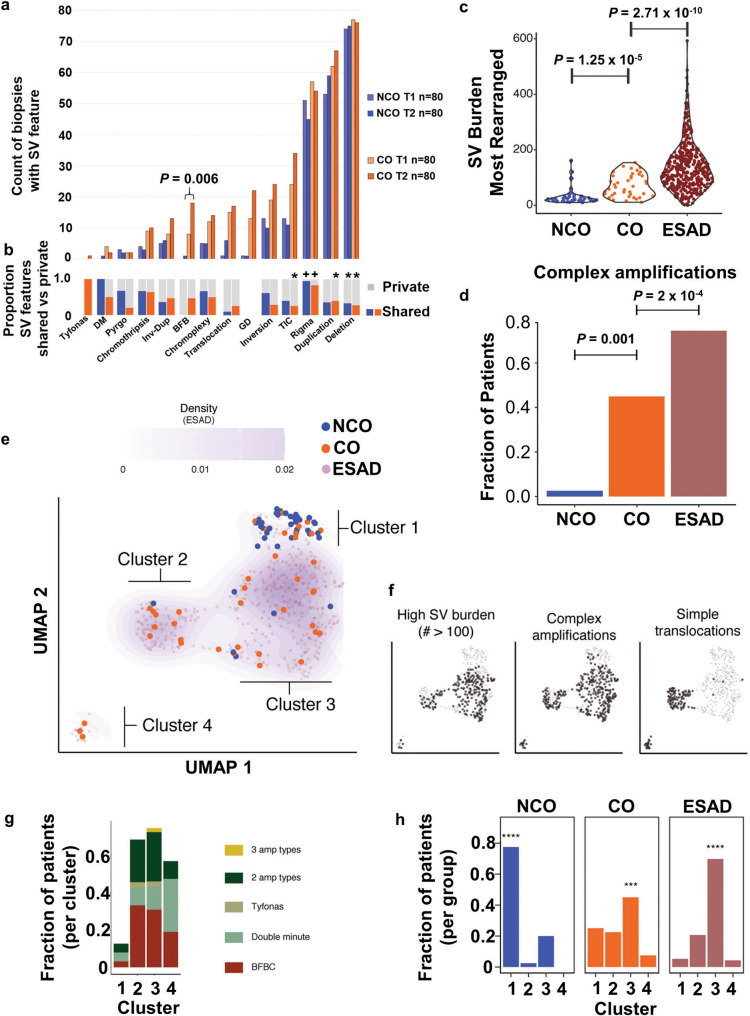
Fig. 6. Complex structural alterations in progression to ESAD.
a Plot shows count of biopsies with SV features in T1 and T2 biopsies in NCO and CO (n = 80 biopsies in each category of T1 NCO, T1 CO, T2 NCO, T2 CO). Comparison between T1 and T2 by Wilcoxon rank-sum test. b Proportion of SV events that are private to a single biopsy (grey) or shared between two or more biopsies (blue=NCO, orange=CO). (+) indicates significantly higher load of this SV feature is shared; (*) asterisk indicates a significantly higher load of SV feature is private, FDR 0.01 (Supplementary Data Fig. 9) c Total SV burden of NCO (n = 40), CO (n = 40) and ESAD (n = 408) patients, represented by the most rearranged sample per case. Statistical enrichment determined by Gamma-Poisson regression of SV burden as a function of group status, correcting for TP53 mutational status. d Fraction of cases that harbor a complex amplification (BFB, double minute, and/or tyfonas), in NCO (n = 40), CO (n = 40) and ESAD (n = 408) (represented by presence of complex amplification type in any patient sample). Mann–Whitney U test was used for each comparison. e Left, UMAP clustering of NCO, CO, and ESAD patients using junction burden of most rearranged samples attributed to SV event types as input. Density contours determined on the basis of ESAD data only, with faded purple dots representing ESAD data points. Clusters determined by Gaussian mixture model regression. f Each sample harboring the SV feature of interest is represented by black dots in the scatterplot, while others are colored transparent grey. g Fraction of patients within each cluster containing complex amplification types. h, Fraction of NCO (n = 40), CO (n = 40), and ESAD (n = 408) cases within each cluster. Asterisks indicate the highest fraction is significantly higher than the other three (chi-square test, **** P = 2.2 × 10⁻¹⁶; *** P = 0.0017). Source data are indicated in Figure Source Data File.

