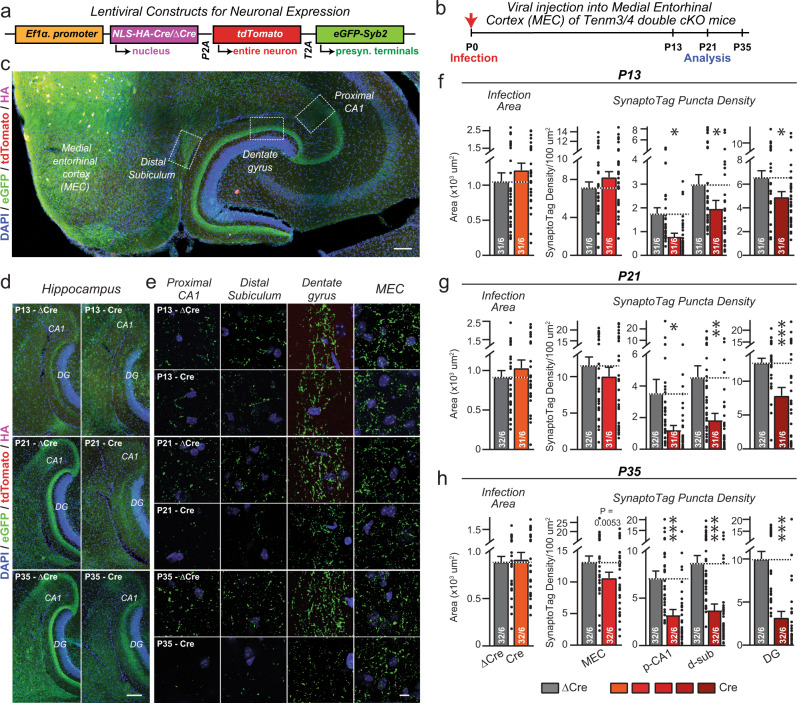
Fig. 6. SynaptoTag mapping reveals that inactivation of Tenm3 and Tenm4 expression in the MEC severely impairs synapse formation by entorhinal cortex projections onto neurons in the proximal CA1, distal subiculum, and dentate gyrus.
a Design of SynaptoTag lentiviruses used for the presynaptic tracing of synaptic connections. The Ef1α promoter drives the expression of HA-tagged Cre or ∆Cre, tdTomato, and a presynaptic eGFP-synaptobrevin-2 fusion protein (eGFP-Syb2). The HA signal visualizes the viral injection area, the soluble tdTomato signal visualizes axonal projections, whereas the eGFP-Syb2 signal visualizes presynaptic specializations. Sections were stained for HA (magenta), tdTomato (red), eGFP (green) and DAPI (blue). b Experimental strategy. The MEC neurons of Tenm3/4 DcKO mice were stereotactically injected with the SynaptoTag lentiviruses at P0, and mice were analyzed by imaging at P13, P21, and P35. c Representative image of a horizontal section of the hippocampal formation from a SynaptoTag experiment. Boxes illustrate the areas that were analyzed by eGFP-Syb2 signal quantification. Representative low (d) and higher resolution images (e) at P13 (top), P21 (middle), or P35 (bottom) of the SynaptoTag signals in hippocampal sections after infection of the MEC with control (∆Cre, left) and test SynaptoTag lentiviruses (Cre, right). The panels in d show overviews, while the panels in e depict the indicated areas of the hippocampal formation. f–h Quantifications of the SynaptoTag signal reveal that the Tenm3/4 deletion in the MEC causes a large decrease in MEC-derived synapses in the proximal CA1, distal subiculum, and dentate gyrus, but not in the MEC itself, at all time points analyzed (f, P13; g, P21; h, P35). Left graphs show the size of the lentivirally infected areas in the MEC; right graphs show the SynaptoTag puncta density in the MEC, proximal CA1 (p-CA1), distal subiculum (d-sub), and dentate gyrus (DG). Data are means ± SEM; numbers of sections/mice are indicated in the bars. Statistical significance was assessed using two-sided Student’s t-test and Two-way ANOVA (*p < 0.05; **p < 0.01; ***p < 0.001). For additional experiments and quantifications, see Supplementary Fig. 9. Scale bars: 0.5 mm (c), 0.2 mm (d) and 20 µm (e).

