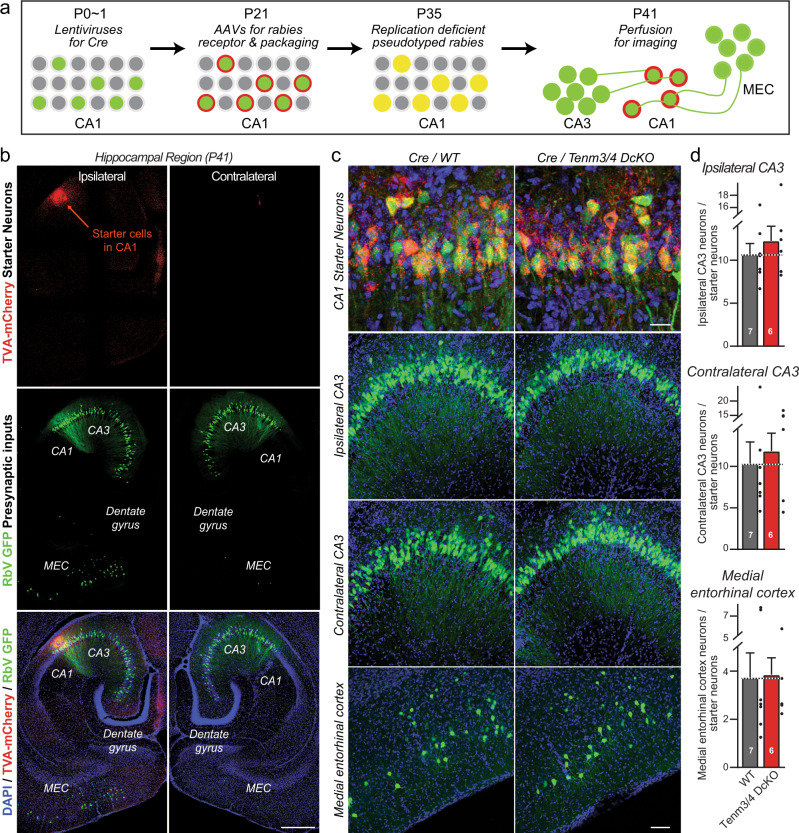
Fig. 7. Retrograde trans-synaptic pseudorabies virus tracing demonstrates that the postsynaptic deletion of Tenm3 and Tenm4 in CA1 region neurons has no effect on the formation of synapses on CA1 neurons.
a Experimental strategy. The proximal CA1 neurons of WT or Tenm3/4 DcKO mice were sparsely infected unilaterally with lentiviruses encoding Cre-recombinase at P0. The same proximal CA1 neurons were then superinfected with AAVs encoding the Cre-dependent mCherry-tagged pseudorabies virus receptor and pseudorabies virus packaging proteins at P21, which are therefore only expressed in neurons containing Cre. Finally, the proximal CA1 was infected with pseudorabies viruses encoding eGFP at P35, and the ipsi- and contralateral hippocampal CA3 and the ipsilateral medial entorhinal cortex were analyzed by imaging at P41. Postsynaptic ‘starter’ neurons in the tracing experiments are double-positive for both mCherry and eGFP, whereas presynaptic input neurons are positive only for eGFP. b Representative images of a pseudorabies virus tracing experiment in the hippocampal formation (red, starter neurons expressing the mCherry-tagged pseudorabies virus receptor; green, eGFP-positive neurons containing pseudorabies viruses). c Representative higher resolution images of retrograde trans-synaptic tracing experiments in control mice (left images) and mice with a postsynaptic deletion of Tenm3/4 (right images). Images show starter neurons (top), ipsi- and contralateral presynaptic CA3 region input neurons (middle rows), and ipsilateral MEC input neurons (bottom). d Quantifications of presynaptic inputs onto postsynaptic proximal CA1 neurons as a function of the postsynaptic Tenm3/4 deletions show that postsynaptic Tenm3 and Tenm4 are not required for normal synaptic connections formed by MEC and CA3 neurons onto CA1 neurons. Data are means ± SEM; numbers of mice are indicated in the bars. Statistical significance was assessed using two-sided Student’s t-test (non significant comparisons are not indicated). Scale bars: 0.5 mm (b), 20 µm (c, top panel) and 100 µm (c, bottom three panels).

