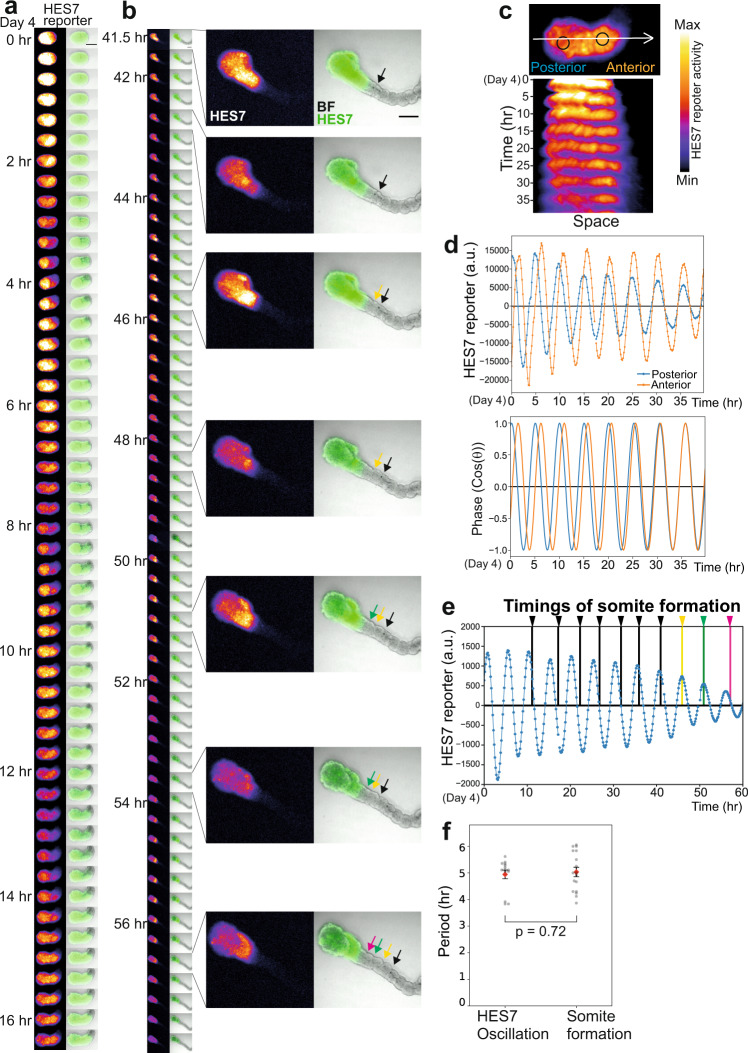
Fig. 3. Somites are formed according to the segmentation clock.
a, b Time-lapse images of the HES7 promoter-luciferase reporter activity in a representative somitoid. The starting point on day 4 was defined as time 0. See also Supplementary Movie 4. Scale bars: 500 µm. Images were taken by an LV200 luminescent microscope. b Enlarged images of several time points are also shown. Arrows indicate the somite boundaries. BF: Bright field. c Kymograph of the HES7 reporter activity measured along the posterior-anterior axis (the white arrow) of the same sample shown in a, b. d Detrended intensity (top) and the oscillation phase (bottom) of the HES7 reporter activity in the same sample shown in a, b. Blue and orange lines indicate the signals measured in the posterior and anterior regions of somitoids, respectively, marked in c. The gaps in the graph correspond to short halts of imaging to adjust the sample position. N = 14 samples showed similar oscillatory patterns. e Relationship between HES7 oscillations and segmentation timings. Detrended HES7 reporter activity of the entire image of the same sample shown in a and b. Arrows indicate the timings of somite formation, and the colors correspond to the arrows in b. f Periods calculated from the HES7 oscillations and somite formation. Mean ± SEM. Each point in the graph indicates an average period of several oscillation peaks or somite formation timings in one sample from day 5 to day 6. N = 14 (HES7 oscillation) and 17 (Somite formation). 5 independent experiments. P-value is from two-sided student’s t-test. Source data are provided as a Source Data file.

