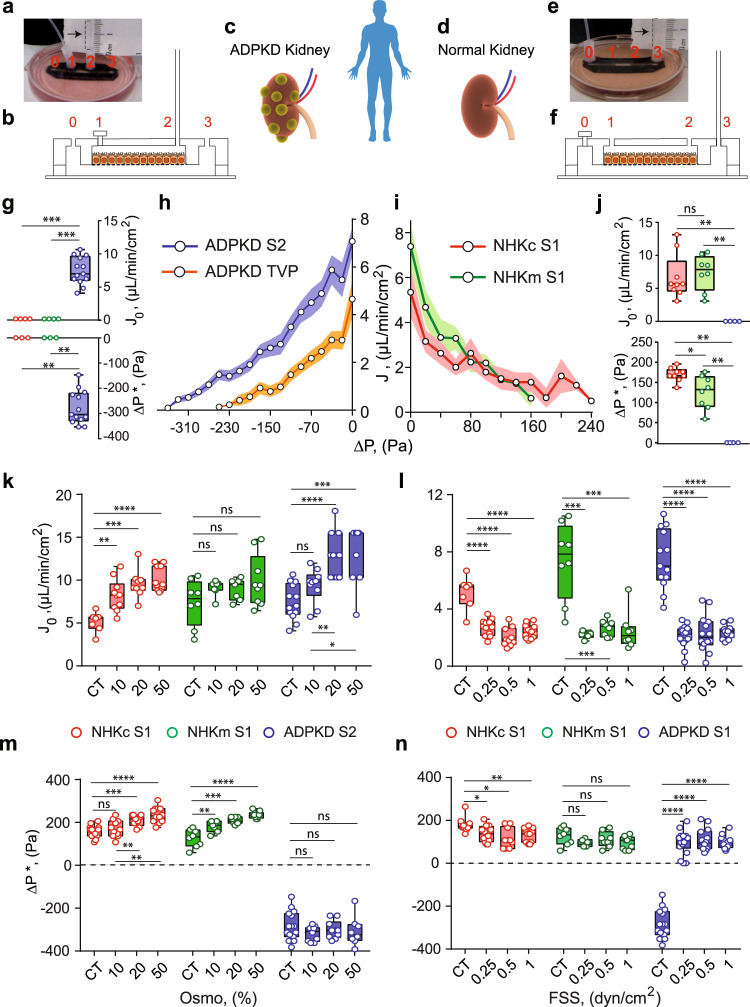
Fig. 4. Cystic cells derived from ADPKD patients pump fluid in the opposite direction as normal human kidney cells.
a, b A snapshot and schematic of MFKP in setup-2 (S2). A cystic ADPKD kidney (c) and an normal kidney (d) derived from patients. e, f A snapshot and schematic of the MFKP in setup-1 (S1). g Measured J0, and ΔP*, for NHKc (N = 4, biological replicates), NHKm (N = 4) and ADPKD (N = 13) epithelia using S2. For J0, ***pNHKc-ADPKD = ***pNHKm-ADPKD = 0.0008 and for ∆P*, **pNHKc-ADPKD = **pNHKm-ADPKD = 0.0036. h Pump performance curve (PPC) of ADPKD epithelium using S2. (N = 13, biological replicates). 10 nM Tolvaptan (TVP) (N = 12, biological replicates) decreases fluid pumping in ADPKD cystic epithelium. i PPCs of NHKc (N = 10) and NHKm (N = 8) epithelia using S1. Shaded area is the SEM. j Comparison of J0, and ΔP*, for NHKc (N = 9, biological replicates), NHKm (N = 8) and ADPKD (N = 4) epithelium using S1. For J0, pNHKc-NHKm = 0.5249, **pNHKc-ADPKD = 0.0014, **pNHKm-ADPKD = 0.0040 and for ∆P*, *pNHKc-NHKm = 0.0166, **pNHKc-ADPKD = 0.0028, **pNHKm-ADPKD = 0.0040. Comparisons of J0 with (k) varying hypo-osmotic gradients in NHKc (N = 7, 10, 9, 11, biological replicates for CT, 10%, 20 and 50%, **pCT-10% = 0.0018, ***pCT-20% = 0.0002, ****pCT-50% < 0.0001), NHKm (N = 8, 7, 7, 9, pCT-10% = 0.2319, pCT-20% = 0.3969, pCT-50% = 0.1388) and ADPKD (N = 12, 10, 11, 8, pCT-10% = 0.0554, ****pCT-20% < 0.0001, ***pCT-50% = 0.001) epithelia. l Fluid shear stresses in NHKc (N = 7, 12, 10, 12, biological replicates for CT, 0.25, 0.5 and 1, ****p < 0.0001), NHKm (N = 8, 6, 8, 8, ***pCT-0.25 = 0.0007, ***pCT-0.5 = 0.0006, ***pCT-1 = 0.0006) and ADPKD (N = 13, 16, 14, 11, ****p < 0.0001) epithelia. m Comparison of ΔP* in NHKc (N = 12, 11, 9, 12 biological replicates for CT, 10%, 20 and 50% osmotic gradients, pCT-10% = 0.4324, ***pCT-20% = 0.0003, ****pCT-50% < 0.0001), NHKm (N = 8, 7, 7, 8, **pCT-10% = 0.0099, ***pCT-20% = 0.0002, ****pCT-50% < 0.0001) and ADPKD (N = 15, 9, 9, 8, pCT-10% = 0.22, pCT-20% = 0.594, pCT-50% = 0.417). n And for fluid shear stresses in NHKc (N = 9, 12, 10, 11, biological replicates for CT, 0.25, 0.5 and 1 dyn/cm2, *pCT-0.25 = 0.0237, *pCT-0.5 = 0.015, **pCT-1 = 0.003), NHKm (N = 8, 5, 8, 9, pCT-0.25 = 0.1152, pCT-0.5 = 0.4547, pCT-1 = 0.1306) and ADPKD (N = 15, 12, 14, 12, ****p < 0.0001. Unpaired, two-tailed, Mann–Whitney t-test. See Fig. 1 caption for explanation of box-plot.

