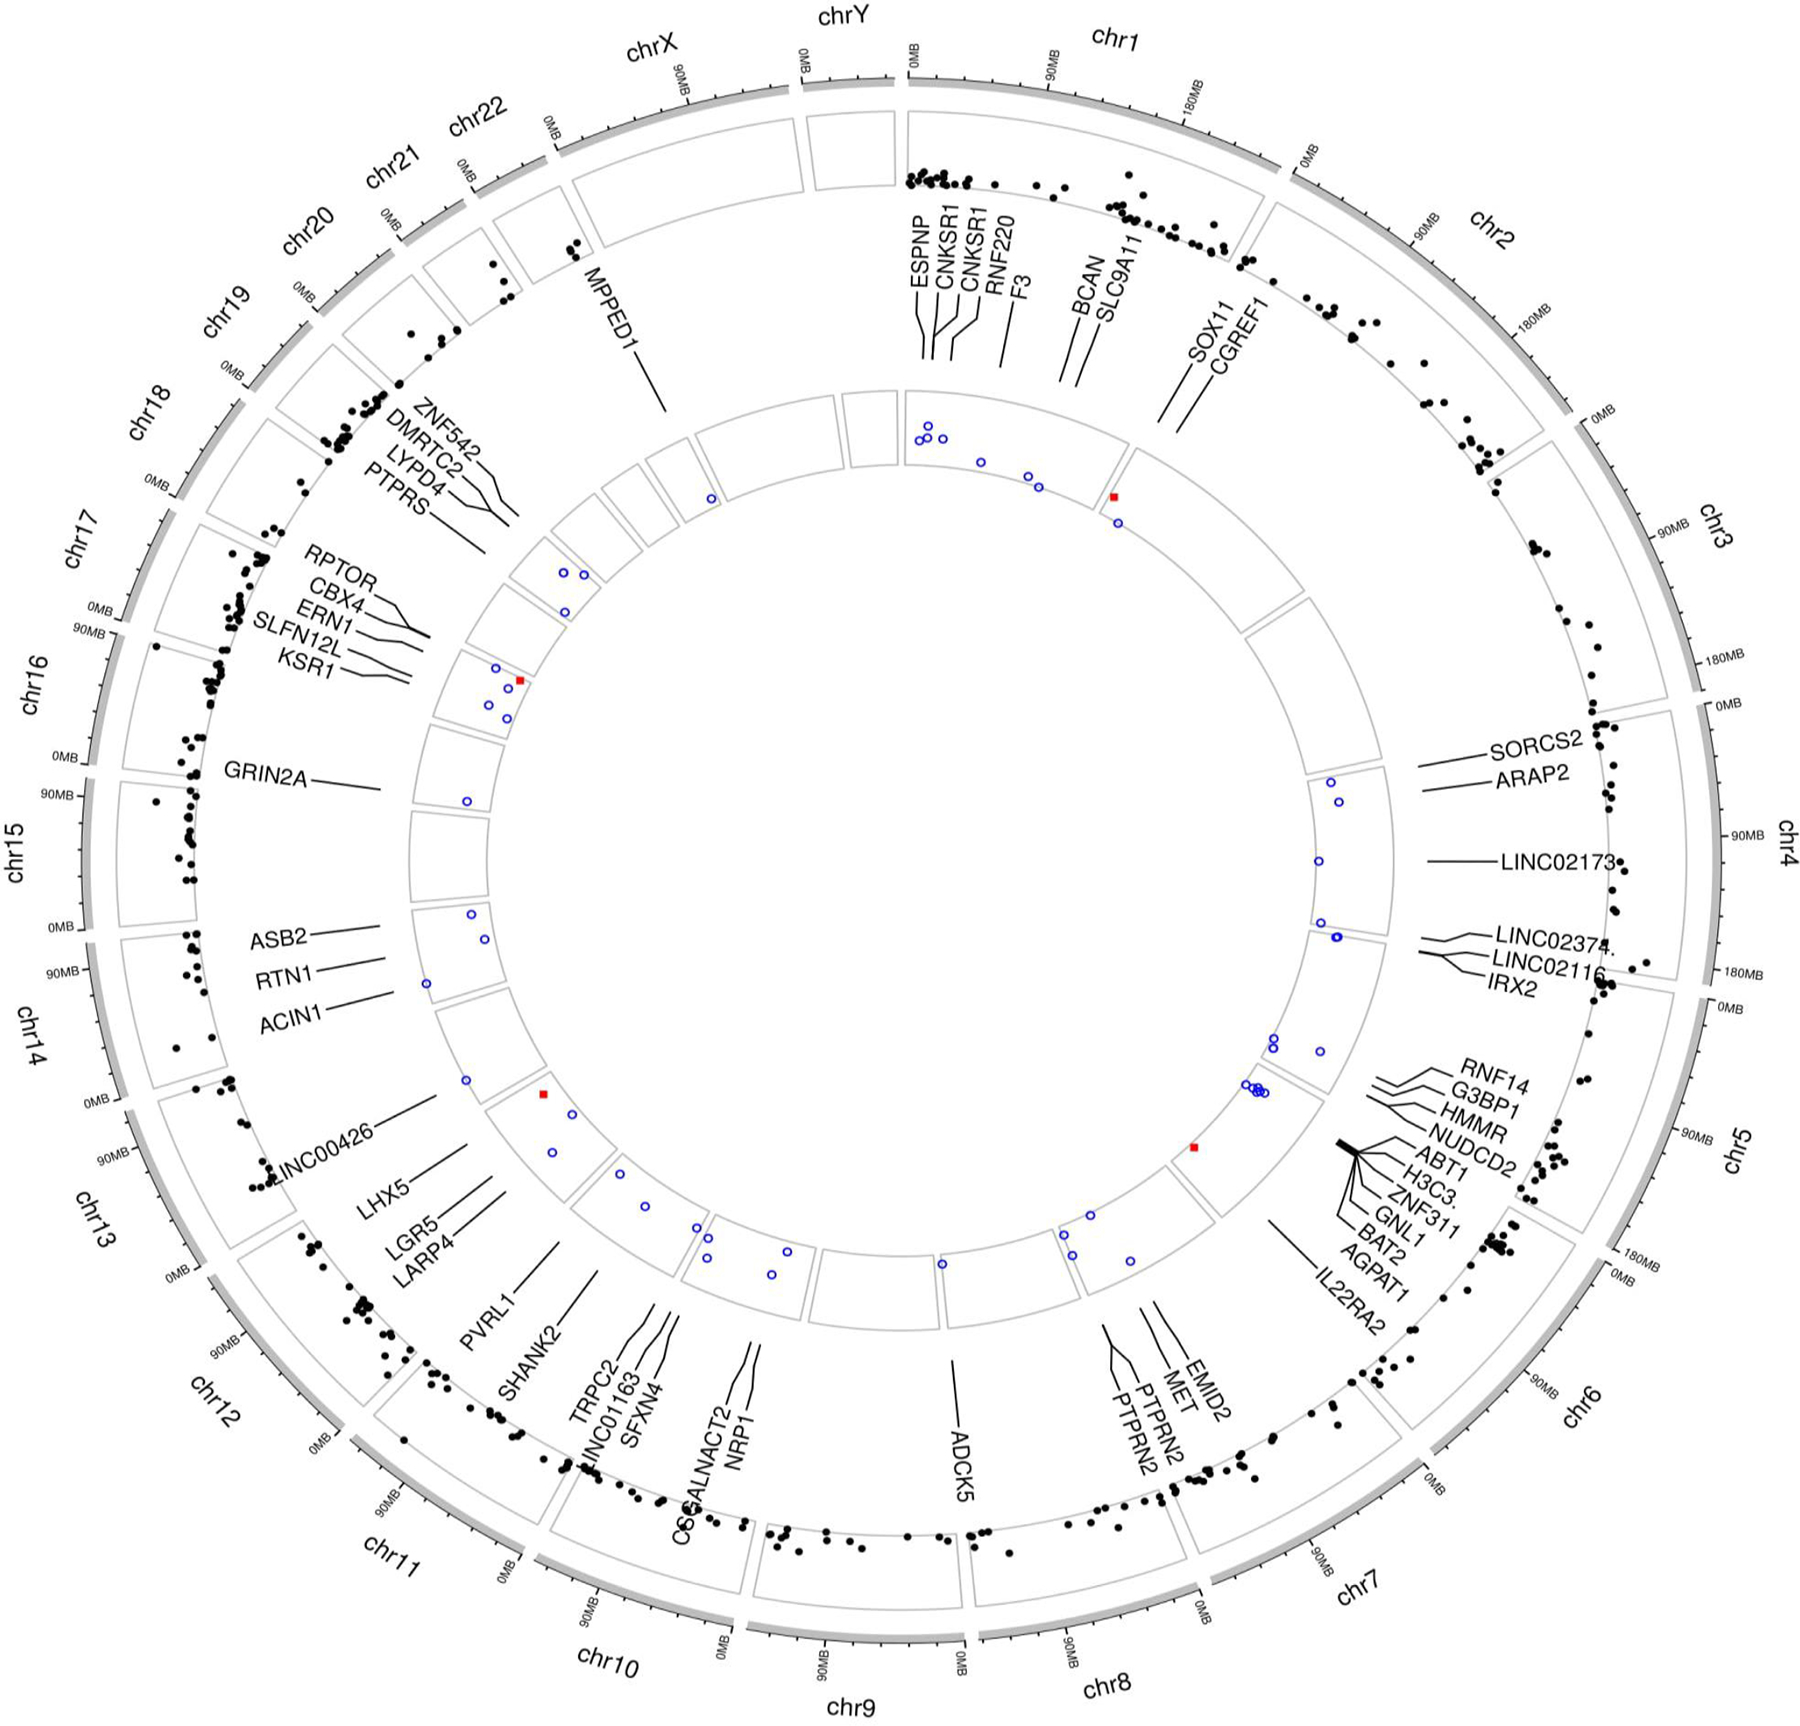
FIGURE 2.

Circos plot of mapping genes of CpGs survived screening via linear regression or identified by DMR and those with consistent directions in two cohorts for adolescence asthma acquisition in females (A circos plot was drawn on the website (https://yimingyu.shinyapps.io/shinycircos/), indicating the location of genes corresponding to the CpGs. The outer track is for the location of mapping genes survived screening or identified by DMR, and the inner track is for the location of mapping genes corresponding to identified CpG with consistent directions between the two cohorts).
On outer track, the black points represent −log10 transformed p-values of CpGs that survived screening via linear regression or identified via DMR. On the inner track, the blue unfilled circles and red filled squares denote −log10 transformed p-values of association with adolescence asthma acquisition for those with consistent direction of associations between the two cohorts (but in ALSPAC the effects were statistically insignificant) and those replicated in ALSPAC (in both cohorts, the directions were consistent and the effects were statistically significant), respectively. Chromosome numbers are shown on outermost circle.
