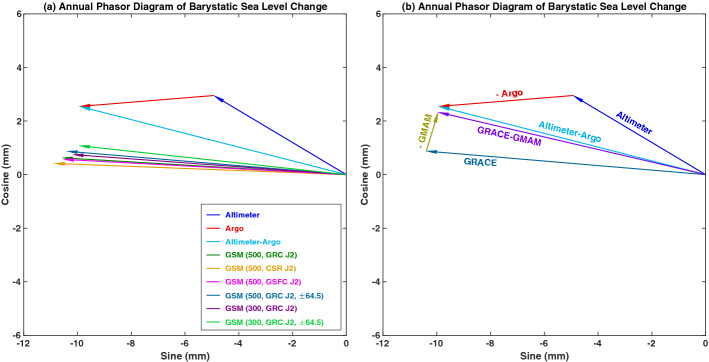
Fig. 4.
a Annual phasor diagram of barystatic sea level changes observed by satellite altimeter and Argo (Altimeter-Argo) and GRACE CSR RL06 GSM solutions over the period January 2005–December 2015. The five GRACE GSM estimates are based on different treatments of (noted as J2 in the legend), ocean basin kernel, and latitude ranges of integration (see Chen et al. 2019 for details); b Annual phasor diagram of barystatic sea level from Altimeter-Argo and GRACE GSM (500 km, GRC J2, ± 64.5) with effect considered

