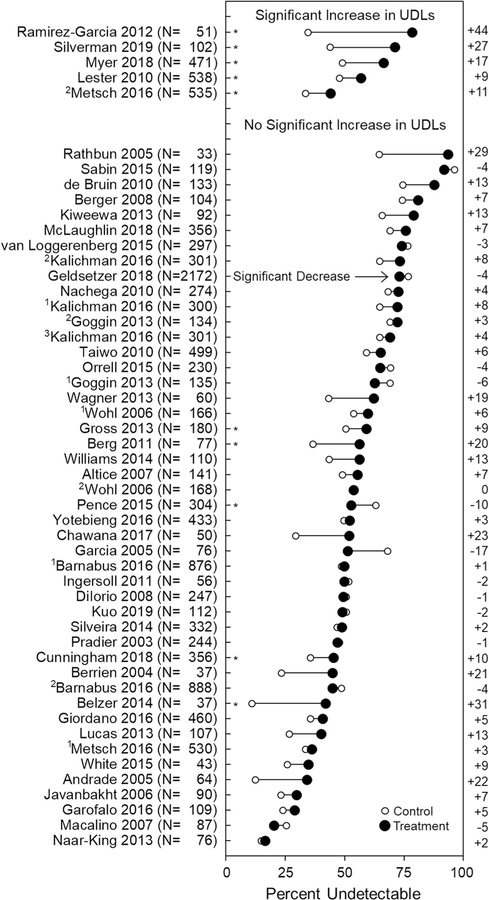
Fig. 2.
Effects of interventions in the main analysis (n = 51). The number of participants assigned to the compared study groups are shown next to the first author and year. Interventions are grouped by whether interventions produced increases in undetectable viral loads (UDLs) that were significant at the p < .05 level. Full statistical analyses are provided for each study in Table 1. Filled circles represent the percentage of blood samples collected at the primary measurement of the study that contained an undetectable HIV viral load, as defined in the study, for participants in the treatment group; unfilled circles show the percentage of samples with an undetectable viral load for the control group. In this analysis, missing samples were imputed as having a detectable viral load. Asterisks in the left portion of the figure show treatment effects that were judged significant in the analysis without imputation of missing samples. The difference in the percentage undetectable between study groups (Treatment–Control) for each intervention is shown to the right of the figure. Superscript numbers (1, 2, or 3) designate the first, second, or third intervention evaluated within a single study and correspond with the superscript numbers in Table 1

