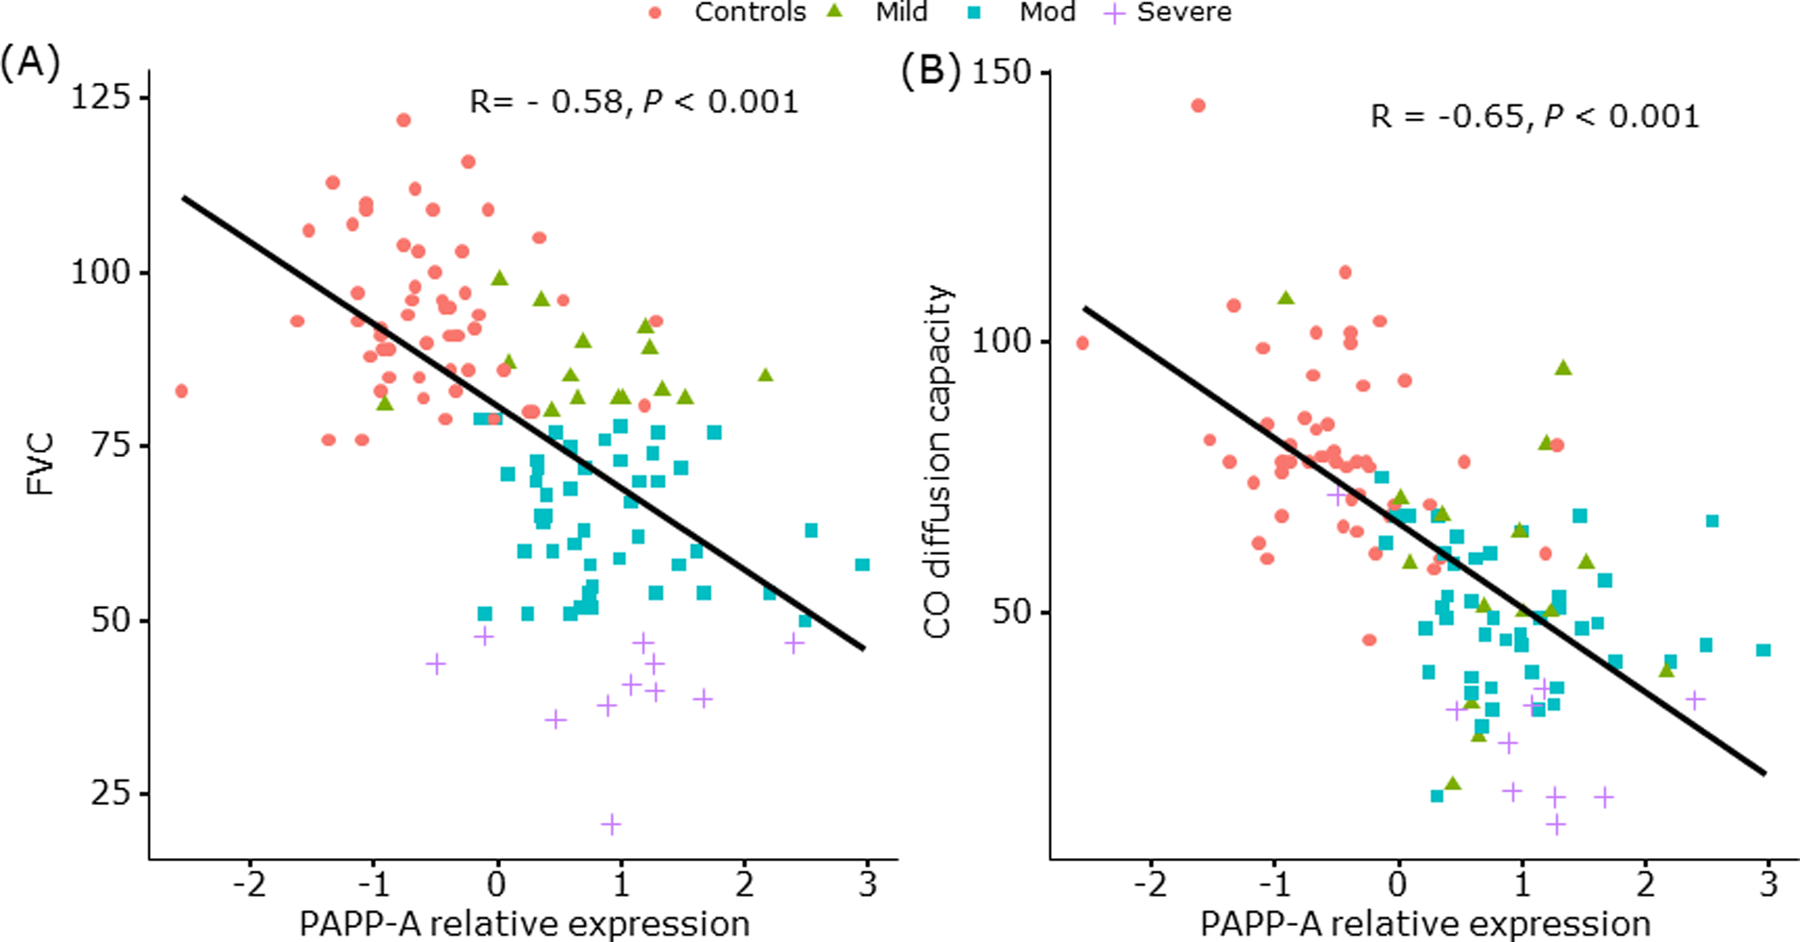
Figure 1.

Relationship between PAPP-A gene expression in lung tissue and severity measures of pulmonary function in IPF
(A) Forced Vital Capacity
(B) Carbon Monoxide Diffusion Capacity
PAPP-A expression levels in lung specimens from control and IPF subjects were measured by microarray (Schafer et al., 2017). Significance of differential expression was determined using linear regression via the functions ImFit and eBayes from the limma package (Smyth, 2004). Pearson correlation coefficients were used to summarize relationship between expression and patient characteristics.
Pink ● Control subjects
Green ▲ Patients with mild IPF
Blue ■ Patients with moderate IPF
Purple + Patients with severe IPF
