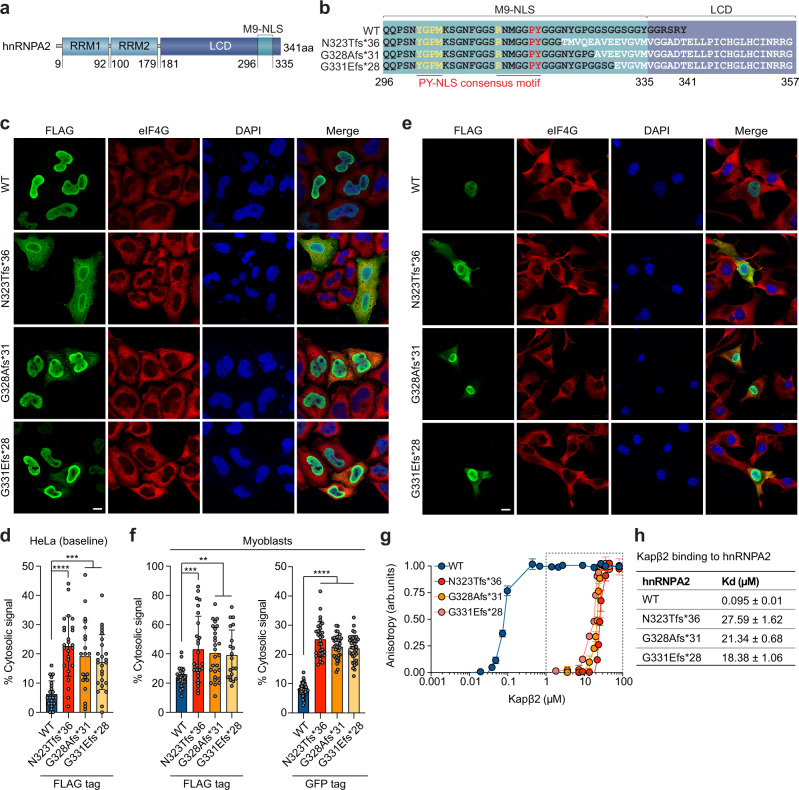
Fig. 3. Frameshift mutations impair nucleocytoplasmic trafficking of hnRNPA2 by disrupting interaction between hnRNPA2 and Kapβ2.
a Domain architecture of hnRNPA2 illustrating RNA recognition motifs 1 and 2 (RRM1 and RRM2), a low complexity domain (LCD), and an M9 nuclear localization signal (M9-NLS) within the LCD. b Amino acid sequences of relevant domains in WT hnRNPA2 and frameshift mutants. Consensus PY-NLS motifs within the M9-NLS are underlined in red. c Intracellular localization of indicated FLAG-tagged hnRNPA2 proteins under basal conditions in HeLa cells. eIF4G was used as a cytoplasmic and stress granule marker. Scale bar, 10 μm. d Quantification of hnRNPA2 cytosolic signal intensity in HeLa cells as shown in (c). An interleaved scatter plot with individual data points is shown; error bars represent mean ± s.d. For WT, N323Tfs*36, G328Afs*31, and G331Efs*28, n = 21, 25, 20, and 25 cells, respectively. ***P = 0.0001 (WT vs. G328Afs*31), ***P = 0.0006 (WT vs. G331Efs*28), and ****P < 0.0001 by one-way ANOVA with Dunnett’s multiple comparisons test. e Intracellular localization of indicated FLAG-tagged hnRNPA2 proteins in C2C12 myoblasts. eIF4G was used as a cytoplasmic and stress granule marker. Scale bar, 10 μm. f Quantification of FLAG-tagged or GFP-tagged hnRNPA2 cytosolic signal intensity in C2C12 myoblasts. An interleaved scatter plot with individual data points is shown; error bars represent mean ± s.d. For FLAG-hnRNPA2, n = 26, 26, 27, and 20 cells for WT, N323Tfs*36, G328Afs*31, and G331Efs*28, respectively. For GFP-hnRNPA2, n = 36, 30, 33, and 35 cells for WT, N323Tfs*36, G328Afs*31, and G331Efs*28, respectively. ****P < 0.0001, ***P = 0.0003 (WT vs. N323Tfs*36), **P = 0.0017 (WT vs. G328Afs*31), and **P = 0.0094 (WT vs. G331Efs*28) by one-way ANOVA with Dunnett’s multiple comparisons test. g Fluorescence polarization measurements between TAMRA-labeled M9-NLS of hnRNPA2 WT, N323Tfs*36, G328Afs*31, or G331Efs*28 peptide (100 nM) with increasing concentrations of Kapβ2. Peptide sequences are shown in (b). Values represent means ± s.e.m. (n = 3 independent experiments). h, Kd values between TAMRA-labeled M9-NLS of hnRNPA2 peptides and Kapβ2 WT. Values were calculated as detailed in Methods and represent means ± s.d. from three independent experiments.

