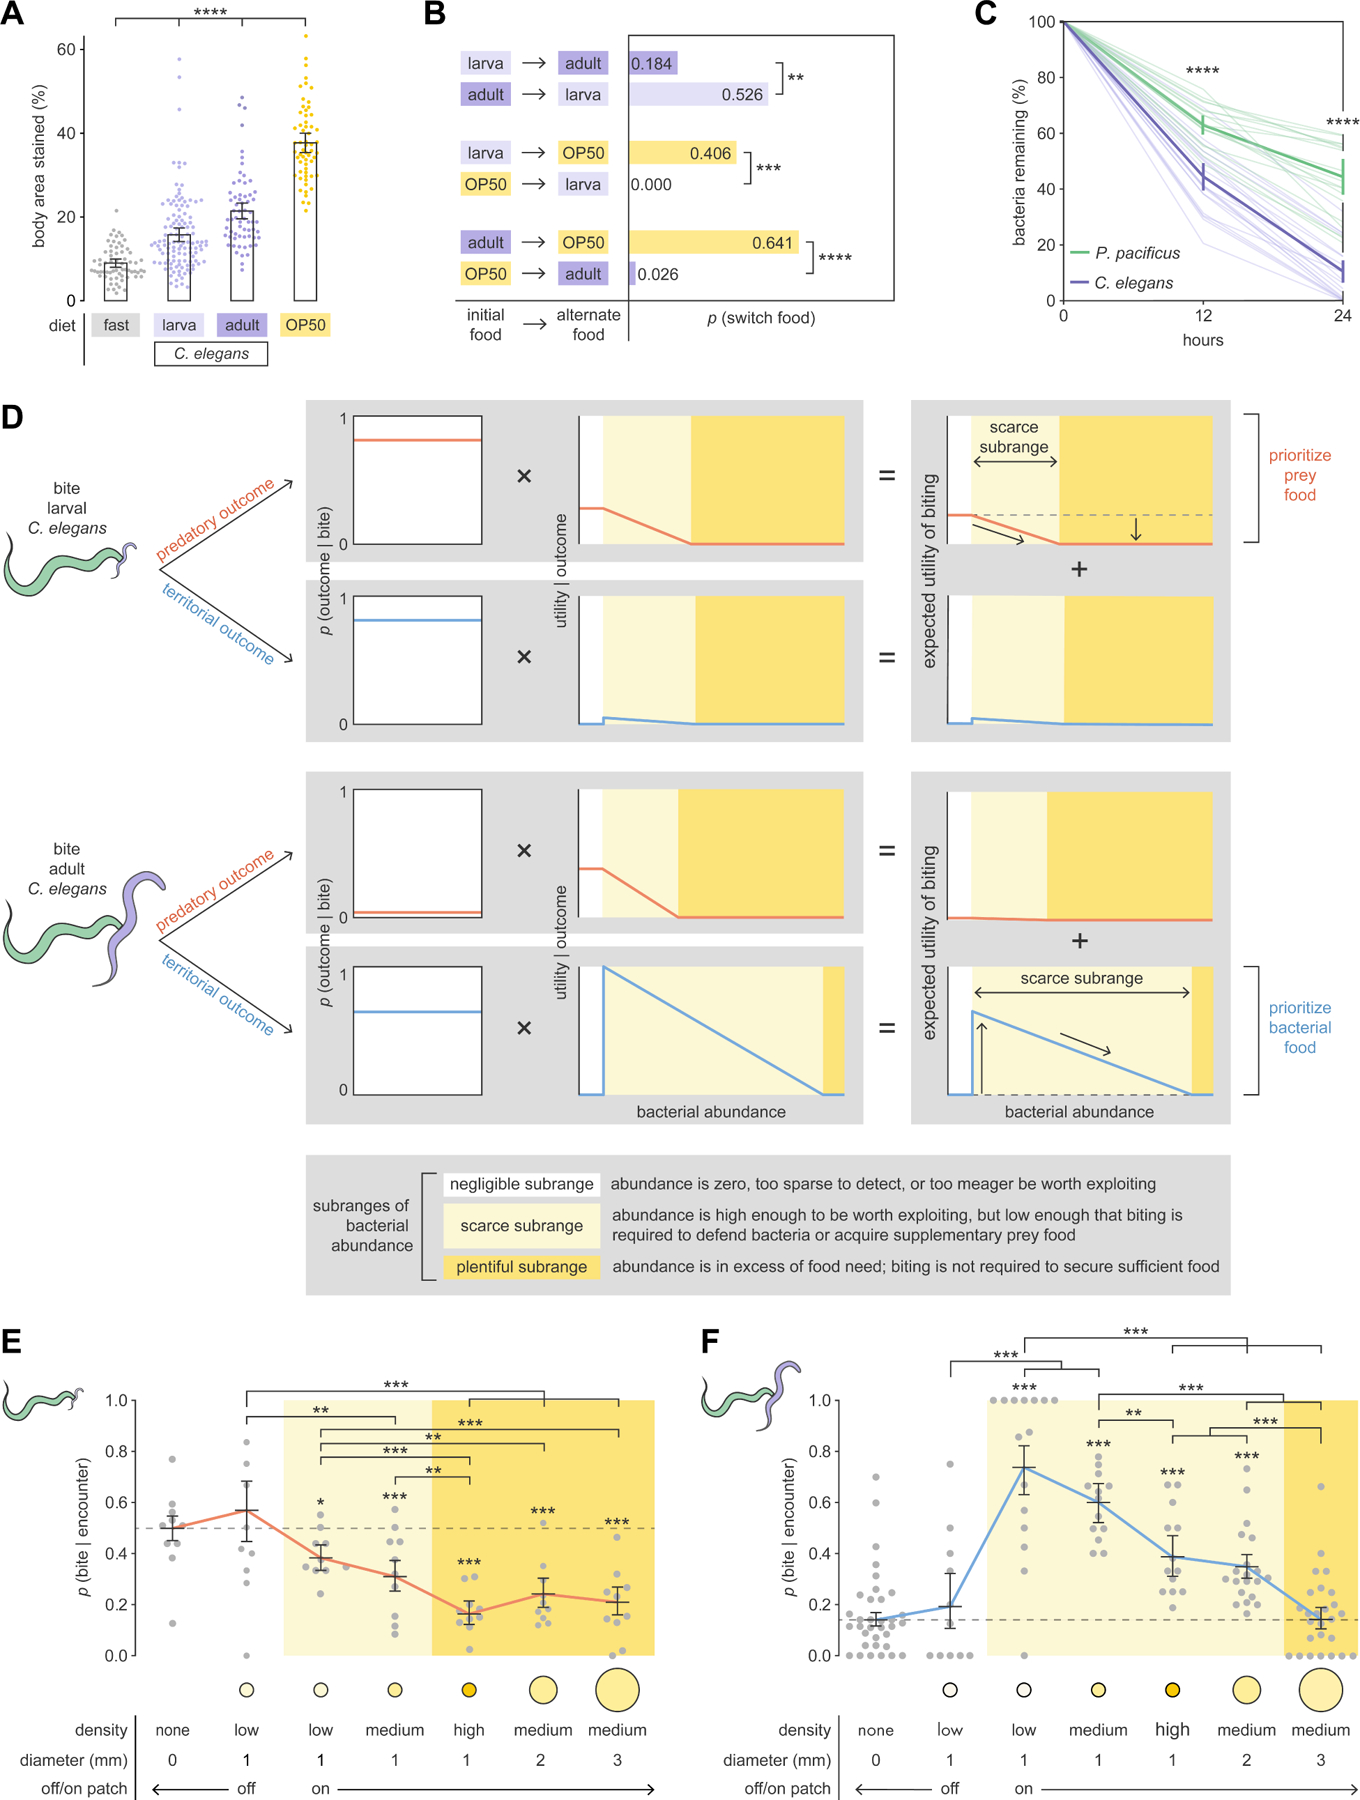
Figure 3. P. pacificus inflicts non-fatal biting to achieve territorial outcomes.

(A) Percent of P. pacificus body stained with Oil Red O after 6 hours on different diets (Dunn’s test with Benjamini–Hochberg adjustment, nP.pacificus = 60–117).
(B) Probability of P. pacificus switching food patches (Fisher’s exact test with Benjamini–Hochberg adjustment, nP.pacificus = 29–39).
(C) Bacteria consumption (Dunn’s test with Benjamini–Hochberg adjustment, nadult = 16–23).
(D) Model of expected utility of biting (dashed lines: expected utility for negligible subrange, vertical arrows: predicted change from negligible subrange, sloped arrows: predicted monotonic decrease). Bacterial abundance and utility are in arbitrary units.
(E) Probability of biting during encounter with larval C. elegans (red line: interpolated) (Wald test with single-step adjustment for Tukey contrasts, nP.pacificus = 9–10, nencounters_per_P.pacificus = 1–66).
(F) Probability of biting during encounter with adult C. elegans (blue line: interpolated) (Wald test with single-step adjustment for Tukey contrasts, nP.pacificus = 12–34, nencounters_per_P.pacificus =1–38).
(E,F) Error bars are predicted probabilities and 95% CIs from binomial logistic regression models of data.
Other error bars are 95% bootstrap CIs.
