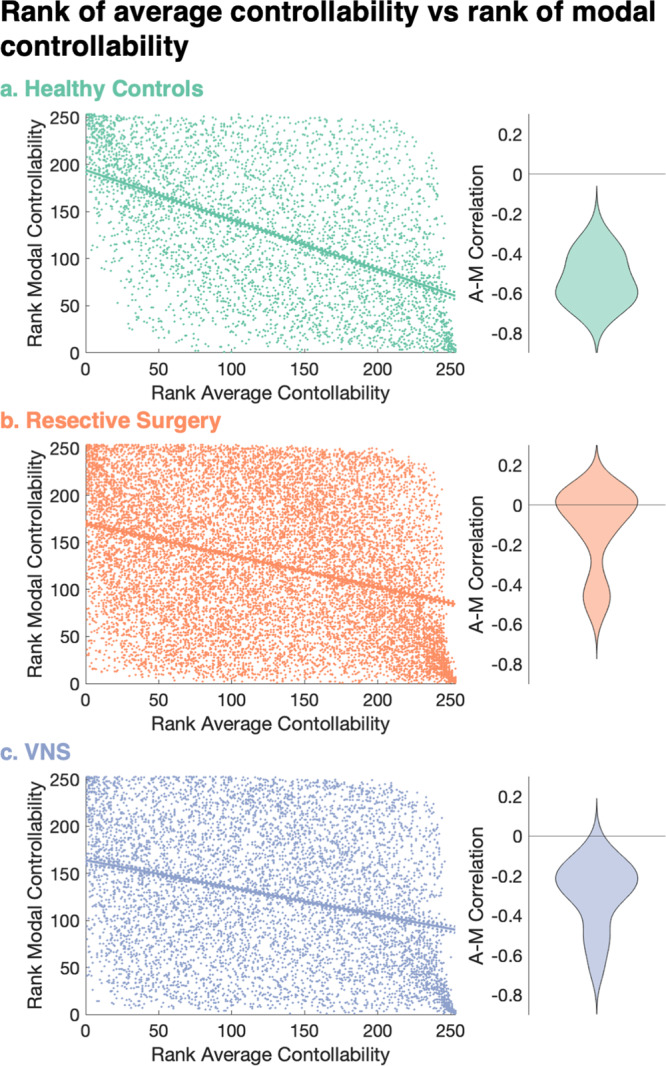
Fig. 3. The inverse correlation between average controllability and modal controllability is weaker in patients with drug-resistant epilepsy.

a–c Correlation between the rank of average controllability and rank of modal controllability (AC-MC correlation) for each parcel across all a healthy controls, b resective surgery and c VNS patients. Lines show the linear regression best fit (solid line) and 95% confidence intervals (dotted lines). Adjacent violin plots show distribution of these correlation coefficients for each individual subject. There were significant differences in the distributions of the correlations at the individual patient level between controls and both groups of patients (p = 7 × 10⁻⁸ for resective surgery and p = 0.02 for VNS after correcting for age, sex, cognitive function, mean weighted degree and multiple comparisons).
