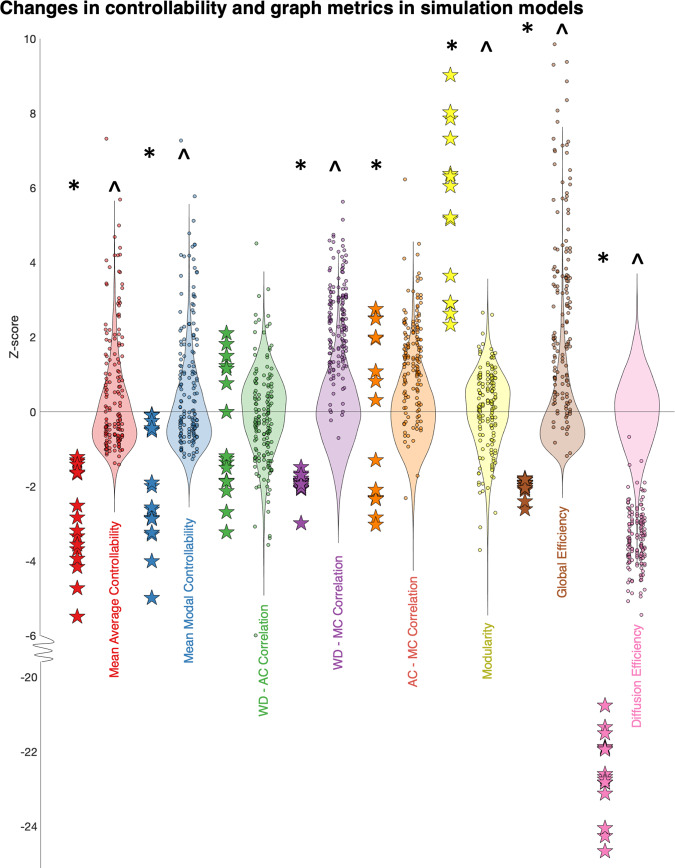
Fig. 4. Changes in controllability and graph metrics observed in patient data are closely recreated by selectively increasing the weight of thalamocortical connections by a low number of streamlines.
Z scored controllability and graph metrics are compared between controls (stars) and anatomically constrained simulations (dots, 10 for each control) of increasing ipsilateral thalamocortical edges (increase in edge weight of 4.5% (1440/31818) of edges by a streamline chosen from a normal distribution with μ = 50, σ = 15). The background violin plots show the null models of increase in the same number of edges by the same weight, constrained to all ipsilateral edges only (200 for each control), on which the Z scores were calculated. The distributions between the controls and constrained thalamocortical models (*) and controls and unconstrained null models (^) were compared using two-sample t tests and adjusted for multiple comparisons (Benjamini–Hochberg FDR method). Compared to the controls, the anatomically constrained thalamocortical models had statistically significant increases in mean average controllability (p < 1 × 10⁻¹⁰), mean modal controllability (p = 3 × 10⁻⁹), WD-MC correlation (p < 1 × 10⁻¹⁰), AC-MC correlation (p = 5 × 10⁻⁴), global efficiency (p = 9 × 10⁻⁹), diffusion efficiency (p < 1 × 10⁻¹⁰) and a decrease in modularity (p < 1 × 10⁻¹⁰). Compared to the controls, the anatomically unconstrained models had statistically significant increases in mean average controllability (p < 1 × 10⁻¹⁰), mean modal controllability (p < 1 × 1–10−10), WD-MC correlation (p < 1 × 10⁻¹⁰), global efficiency (p < 1 × 10⁻¹⁰), diffusion efficiency (p < 1 × 10⁻¹⁰) and a decrease in modularity (p < 1 × 10⁻¹⁰). The specific important differentiator in our patient group (AC-MC correlation) was selectively replicated only in the anatomically constrained thalamocortical model.

