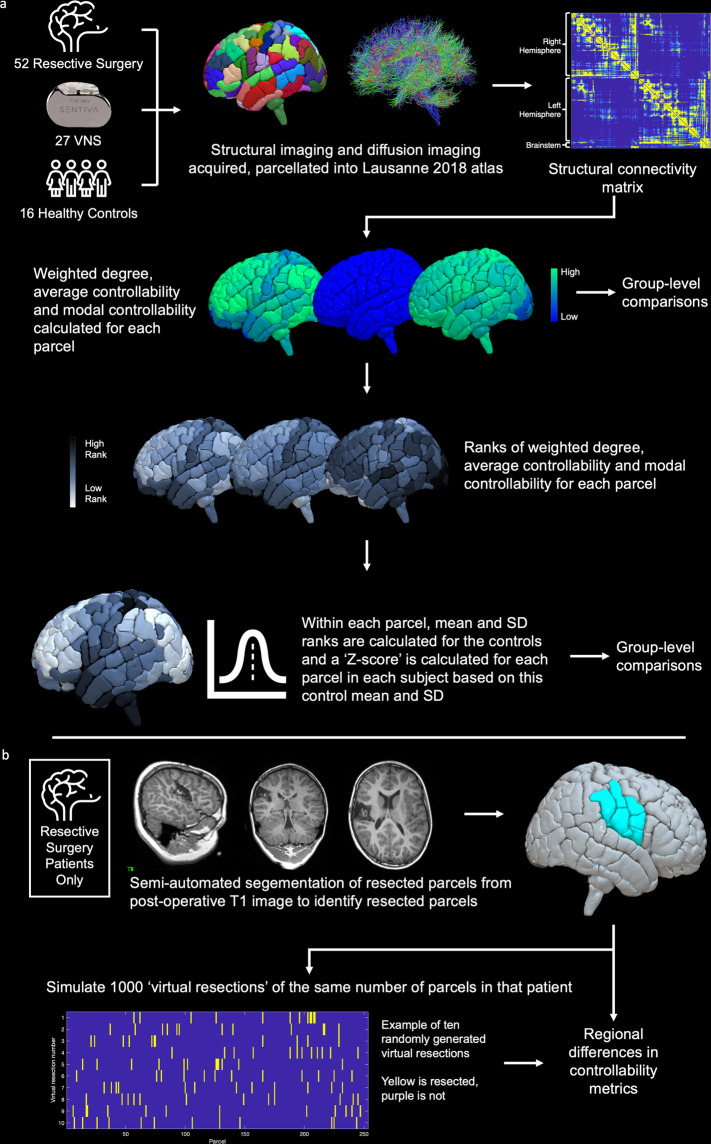
Fig. 7. Summary of image processing workflow.
a Following subject identification, structural imaging was parcellated into Scale 3 of the Lausanne 2018 resulting in 253 parcels per patient. Structural connectivity matrices were generated for each patient where the connection strength was derived from the number of streamlines between each of the 253 parcels. Using these matrices, the weighted degree, average controllability and modal controllability were calculated for each parcel, which were subsequently ranked within each subject and normalised based on the mean and standard deviation of the ranks in the healthy control subjects. b For the resective surgery cohort, resection volumes were mapped to the pre-operative parcellation to identify resected parcels. In order to robustly assess any regional differences, 1000 virtual resections of the same number of parcels as the actual resection were also mapped for each patient.

