
Figure 2: Decomposing a non-linear differentiation process into key components.
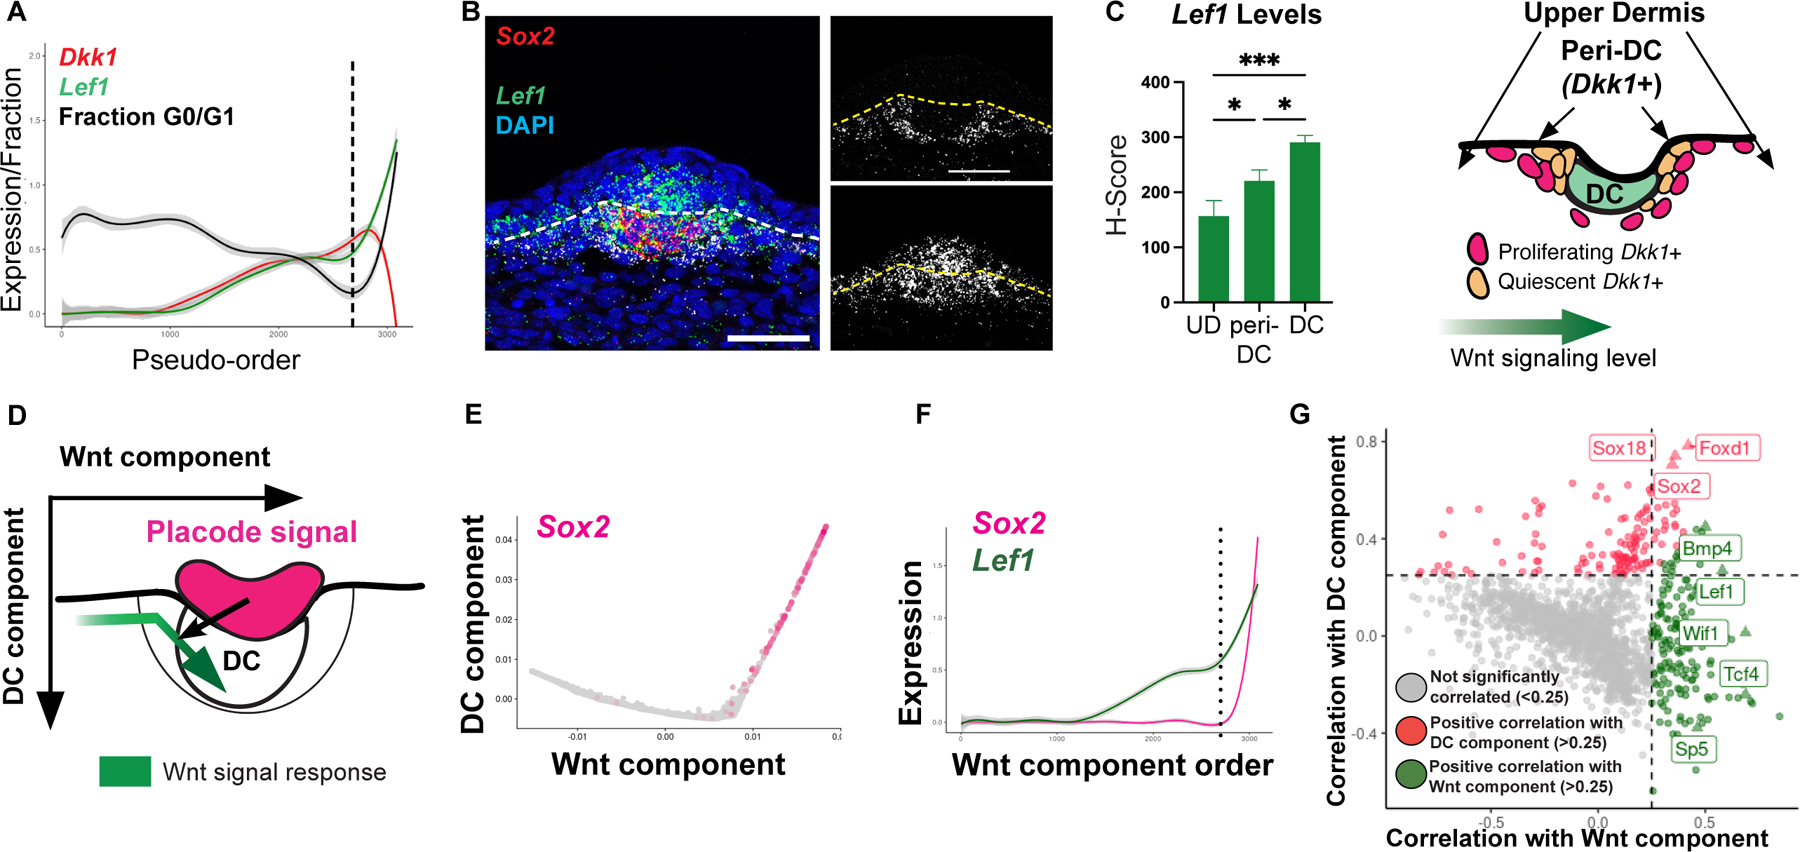
(A) Lef1 and Dkk1 levels by pseudo-order; dashed line, highly proliferative pre-DC state. (B, C) FISH and quantification of Lef1 transcript levels across space (n=4) with schematic of Lef1 levels over space. (D) Cartoon of predicted diffusion map by Wnt and DC components. (E) Diffusion map defined by eigenvectors that most correlate with Lef1 and Sox2. (F) Pseudo-order by Wnt component; dashed line, when Sox2 and Lef1 covary. (G) Correlation plot showing other Wnt targets and DC genes correlate with the two components. Related Figure S2.