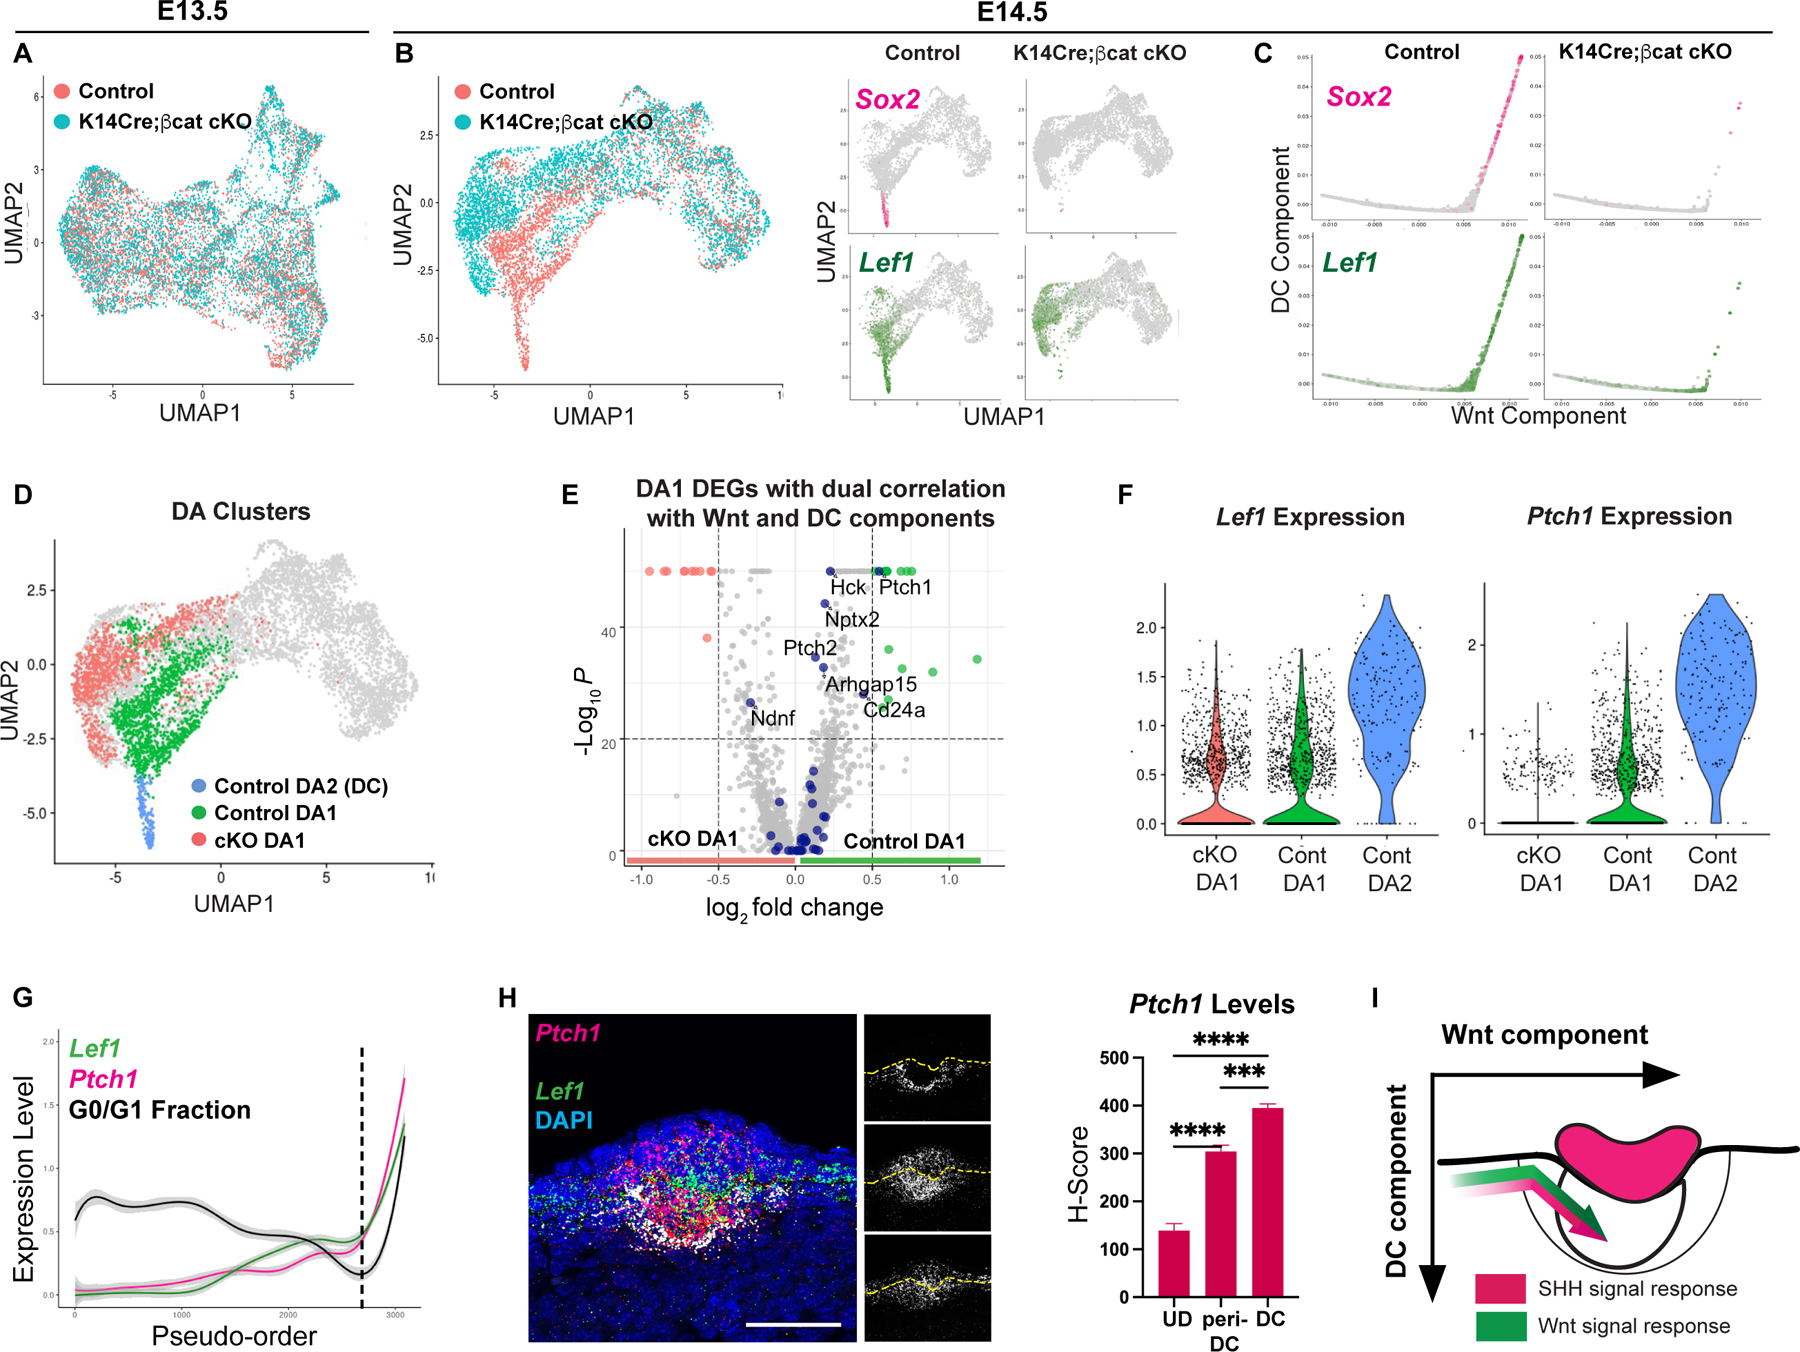
Figure 3: Unbiased identification of the placode factor essential for the transition to the DC component.

(A) UMAP E13.5 dermal cells by condition. (B) UMAP of E14.5 dermal cells by condition (left) or by Lef1 and Sox2 (right). (C) Diffusion maps by Wnt and DC components. (D) Differentially-abundant (DA) clusters of control and K14Cre;βcatfl//fl dermal cells (P < 0.01). (E) Volcano plot of control and mutant DA1 DEGs with genes (navy) that dually correlate with Wnt and DC components. (F) Violin plots of Lef1 and Ptch1 by DA clusters. (G) Pseudo-order showing covarying Ptch1 and Lef1 levels. (H) Quantification of Ptch1 levels across space (n=4). (I) Cartoon depicting SHH and Wnt signal levels by components. Data as mean± SEM; *P<0.05, **P<0.01, ***P<0.001, ****P<0.0001, one-way ANOVA; ns, not significant; scale bars, 50 µm. Related to Figure S3.
