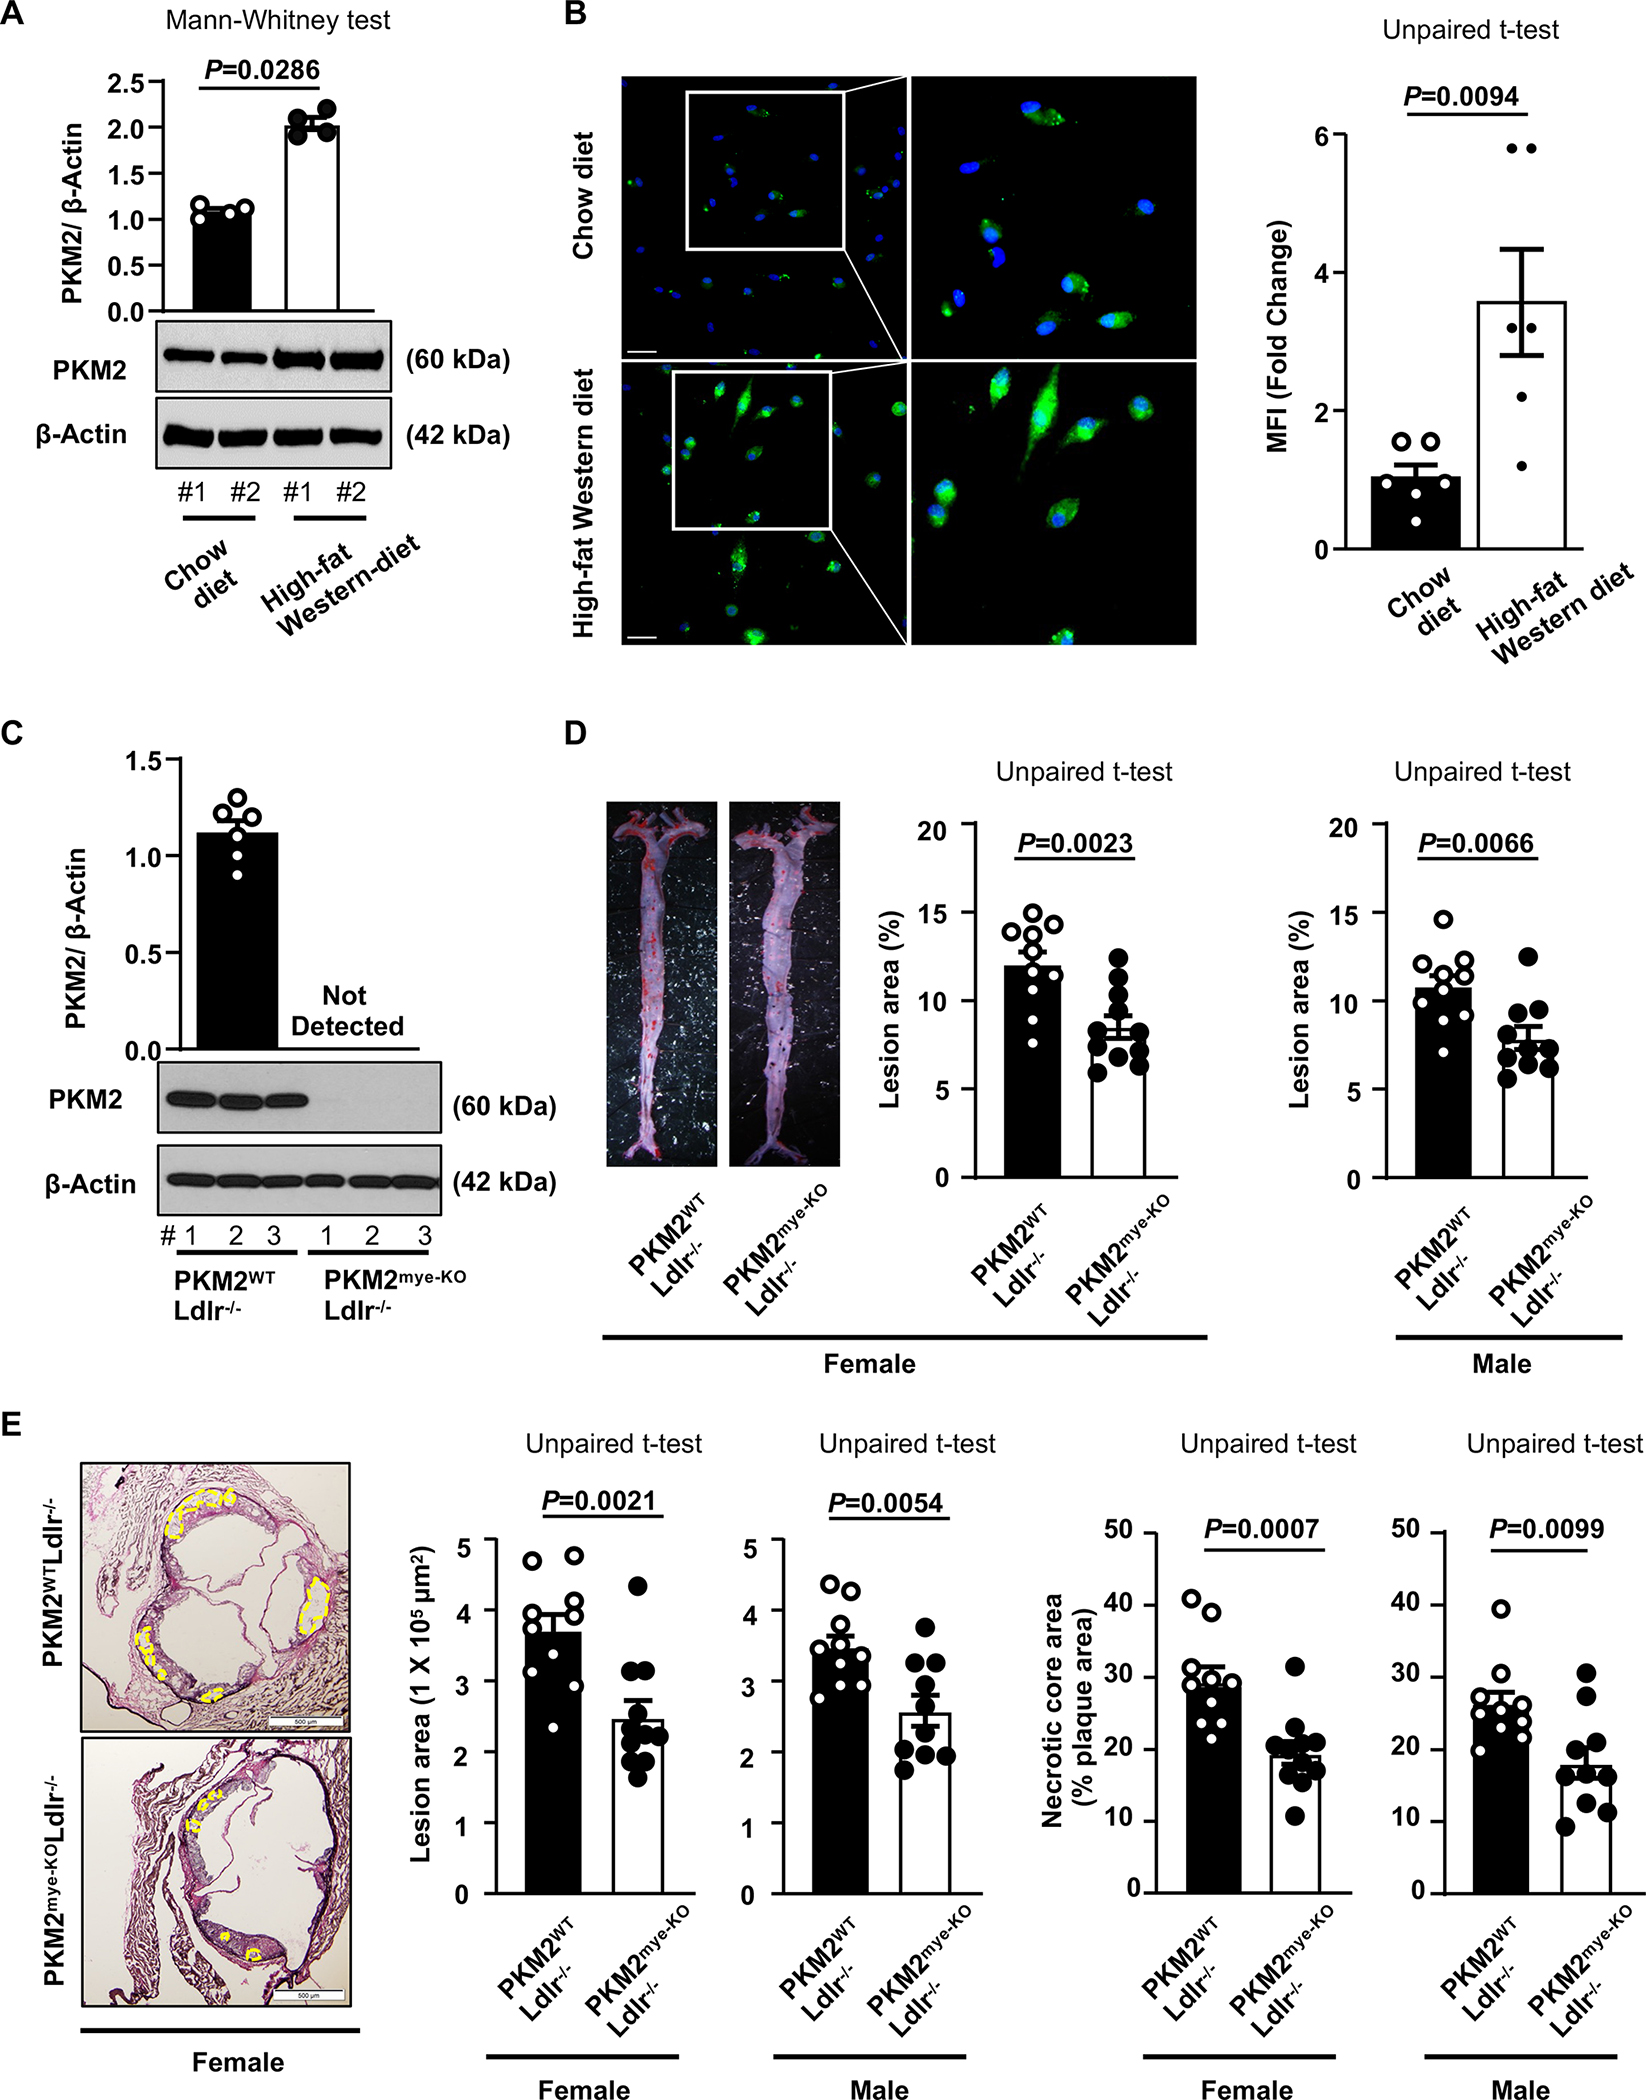
Figure 1. Myeloid cell-specific PKM2−/− mice exhibit reduced atherosclerosis.

A, Representative Western blot and quantification of PKM2 levels in peritoneal macrophages from Ldlr−/− mice fed a chow diet (n=4) or high-fat “Western” diet (n=4) for 14 weeks. Loading control:β-actin. #1, 2, represents individual mouse. B, Left panels show representative immunofluorescence staining of PKM2 (green) from peritoneal macrophages of Ldlr−/− mice fed a chow diet (n=6) or high-fat “Western” diet (n=6) for 14 weeks. Nuclei are counterstained with Hoechst (blue). The boxed region is magnified. The right panel shows the mean fluorescence intensity (MFI). Scale bars, 50 μm. C, Western blot analysis of PKM2 from the peritoneal macrophages (n=6, 6). #1, 2, 3 represents individual mouse. D, Left panels show representative photomicrographs and right panels show quantification of en face lesion area in the whole aortae of female (n=10, 11) or male (n=10, 10) mice fed a high-fat Western-diet for 14 weeks. E, Left panels show representative photomicrographs, middle panels show quantification of cross-sectional lesion area in aortic sinuses, and right panels show acellular (demarcated) necrotic area. Female (n=10, 11), Male (n=10, 10). Scale bar, 500 μm. Results were presented with mean ± SEM. Statistical analysis as indicated in the figure panels.
