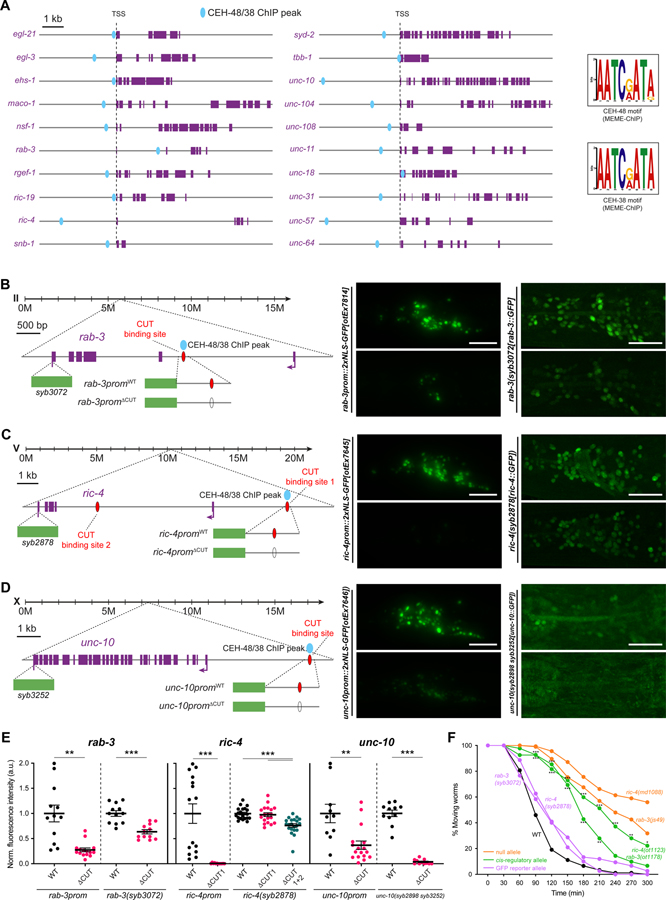
Figure 2. CUT genes binding is required for pan-neuronal gene expression.
(A) Schematic representation of 20 pan-neuronal genes and the location of CEH-48 and CEH-38 peaks found in the ChIP-seq datasets. CEH-48 and CEH-38 peaks overlap for all genes except in maco-1 and tbb-1, which only contain CEH-38 peaks, and ric-19, which only contains a CEH-48 peak. Scale represents 2kb for unc-104 and unc-31. The consensus binding motifs for CEH-48 and CEH-38, extracted from the ChIP-seq datasets using MEME-ChIP 45 are shown on the right. See Data S1A–C for a full list of genes with CEH-48 and CEH-38 ChIP peaks. See Figure S2 for how CUT ChIP binding correlates with the cis-regulatory elements that we previously defined in pan-neuronally expressed genes 3.
(B-D) Schematic representation of rab-3 (B), ric-4 (C) and unc-10 (D) gene loci (left) showing the location of CEH-48/CEH-38 ChIP peaks, CUT homeodomain binding sites, endogenous GFP tags for CRISPR reporters rab-3(syb3072[rab-3::T2A::3xNLS::GFP]), ric-4(syb2878[ric-4::T2A::3xNLS::GFP]), unc-10(syb2898 syb3252[unc-10::T2A::3xNLS::GFP])), and small promoters tested (rab-3prom10::2xNLS-GFP[otEx7814], ric-4prom30::2xNLS-GFP[otEx7645], unc-10prom12::2xNLS-GFP[otEx7646]). Blue ovals indicate binding based on ChIP-seq peak data, red ovals indicate binding site based on sequence. Worm head GFP images showing a reduction in pan-neuronal gene expression when the CUT homeodomain binding site is mutated compared to WT (middle, left). Mutation of the same CUT homeodomain binding sites endogenously in the context of CRISPR reporters affects pan-neuronal expression (middle, right). ric-4 gfp-tagged allele expression is only affected upon mutation of additional CUT homeodomain binding sites (site 1 and 2). unc-10 gfp-tagged allele expression is very dim and expression is not visible in all neurons. All images correspond to worms at the L4 larval stage.
(E) Quantification of small promoters and CRISPR reporters (shown in B-D) head neurons fluorescence intensity in wild-type and upon CUT homeodomain binding site mutations in the regulatory control regions of rab-3 (left), ric-4 (center) and unc-10 (right). The data are presented as individual values with each dot representing the expression level of one worm with the mean ± SEM indicated. Unpaired t-test, **P < 0.01, ***P < 0.001. For ric-4(syb2878[ric-4::T2A::3xNLS::GFP]), one-way ANOVA followed by Tukey’s multiple comparisons test; ***P < 0.001. n ≥ 10 for all genotypes.
(F) Aldicarb-sensitivity defects in wild-type animals, ric-4 and rab-3 CRISPR reporter alleles (rab-3(syb3072), ric-4(syb287)), ric-4 and rab-3 cis-regulatory alleles (ric-4(ot1123 syb2878), rab-3(ot1178 syb3072)), and ric-4 and rab-3 null alleles (ric-4(md1088), rab-3(js49)). Wild-type data is represented with black dots, the CRISPR reporter alleles with purple dots, the cis-regulatory alleles with green dots, and null alleles with orange dots. Two-way ANOVA followed by Tukey’s multiple comparisons test, comparisons for ric-4 and rab-3 cis-regulatory alleles vs wild-type indicated; *P < 0.05, **P < 0.01, ***P < 0.001. n ≥ 3 independent experiments (25 animals per independent experiment). Mean and SEM values are provided in Data S5A.
TSS, transcription start site; WT, wild-type; a.u., arbitrary units. Scale bars 15 μm for all panels except for CRISPR reporters in (B-D), where scale bars equal 10 μm.

