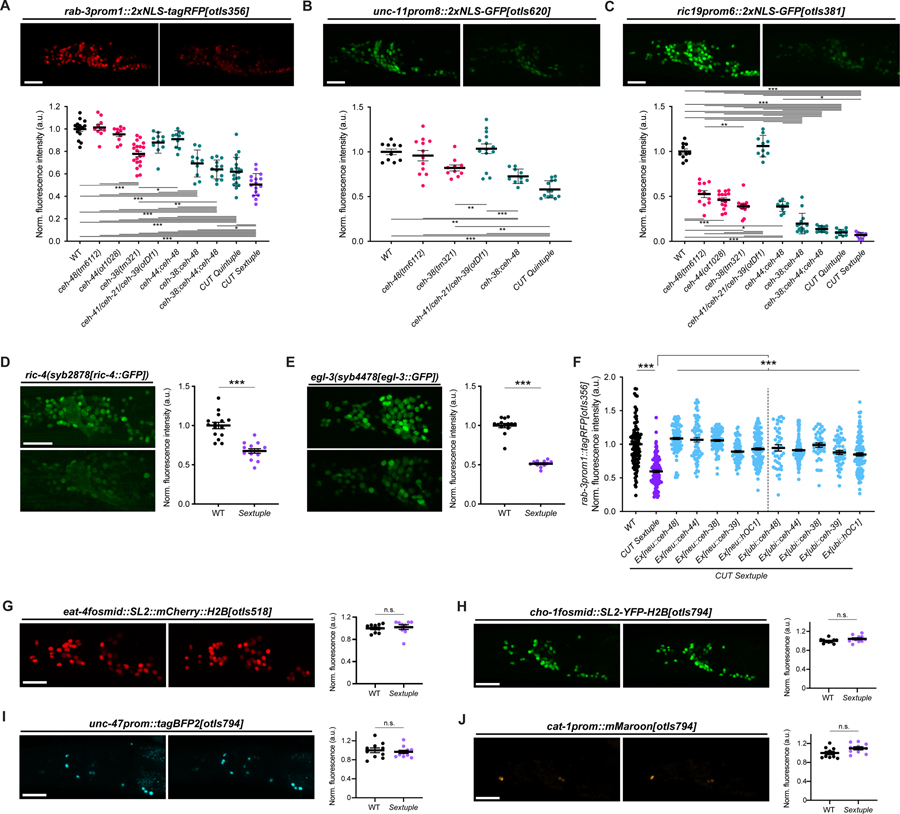
Figure 3. CUT genes act in a dosage-dependent manner to control pan-neuronal gene expression.
(A-C) Expression of rab-3prom1::2xNLS-tagRFP[otIs356] (A), unc-11prom8::2xGFP[otIs620] (B) and ric19prom6::2xNLS-GFP[otIs381] (C) in wild-type (left) and CUT sextuple mutant (right). Lateral views of the worm head at the L4 stage are shown. Quantification of fluorescence intensity in head neurons (bottom) in wild-type, individual CUT mutants (ceh-48(tm6112), ceh-44(ot1028) and ceh-38(tm321)) and compound CUT mutants (otDf1, which deletes ceh-41, ceh-21 and ceh-39; double ceh-44;ceh-48, double ceh-38;ceh-48, triple ceh-38;ceh-44;ceh-48, quintuple ceh-38;ceh-48;otDf1, and sextuple ceh-38;ceh-44;ceh-48;otDf1). unc-11prom::2xGFP[otIs620] and ceh-44 are located in the same chromosome (chr. III) and cannot be recombined together. The data are presented as individual values with each dot representing the expression level of one worm with the mean ± SEM indicated. Wild-type data is represented with black dots, individual CUT mutants with pink dots, the sextuple CUT mutant with purple dots, and other compound CUT mutants with green dots. One-way ANOVA followed by Tukey’s multiple comparisons test; *P < 0.05, **P < 0.01, ***P < 0.001. n ≥ 10 for all genotypes. All genotypes were compared, but only those comparisons that show statistically significant differences are indicated with lines.
(D-E) Expression of ric-4(syb2878[ric-4::GFP]) (ric-4(syb2878[ric-4::T2A-3xNLS-GFP])) (D), egl-3(syb4478[egl-3::GFP]) (egl-3(syb4478[egl-3::SL2-GFP-H2B])) (E) in wild-type (top) and CUT sextuple mutant (bottom). Lateral views of the worm head at the L4 stage are shown. Quantification of CRISPR alleles fluorescence intensity in head neurons. The data are presented as individual values with each dot representing the expression level of one worm with the mean ± SEM indicated. Unpaired t-test, ***P < 0.001. n ≥ 12 for all genotypes.
(F) Expression of rab-3prom::2xNLS-tagRFP[otIs356] was compared between wild-type, CUT sextuple mutant, and CUT sextuple mutant rescue (pan-neuronal, ceh-48 promoter (“neu”, see Figure S4), or ubiquitous, eft-3 promoter (“ubi”), expression of ceh-48, ceh-44, ceh-38, ceh-39 or hOC1). Quantification of fluorescence intensity analyzed by COPAS system (“worm sorter”). The data are presented as individual values with each dot representing the expression level of one worm with the mean ± SEM indicated. Wild-type data is represented with black dots, the sextuple CUT mutant with purple dots, and rescue lines with blue dots. One-way ANOVA followed by Tukey’s multiple comparisons test; ***P < 0.001. n ≥ 40 for all genotypes.
(G-J) Neurotransmitter reporter transgenes in CUT gene mutants. Transgenes are otIs518 (eat-4fosmid::SL2::mCherry::H2B) (G) and otIs794 which contains cho-1fosmid::NLS-SL2-YFP-H2B (H), unc-47prom::tagBFP2 (I), and cat-1prom::mMaroon (J), analyzed in a wild-type (left) or CUT sextuple mutant background (right). Lateral views of the worm head at the L4 stage are shown. Quantification of fluorescence intensity in head neurons. The data are presented as individual values with each dot representing the expression level of one worm with the mean ± SEM indicated. n ≥ 10 for all genotypes.
WT, wild-type; a.u., arbitrary units; n.s., not significant. Scale bars 15 μm.

