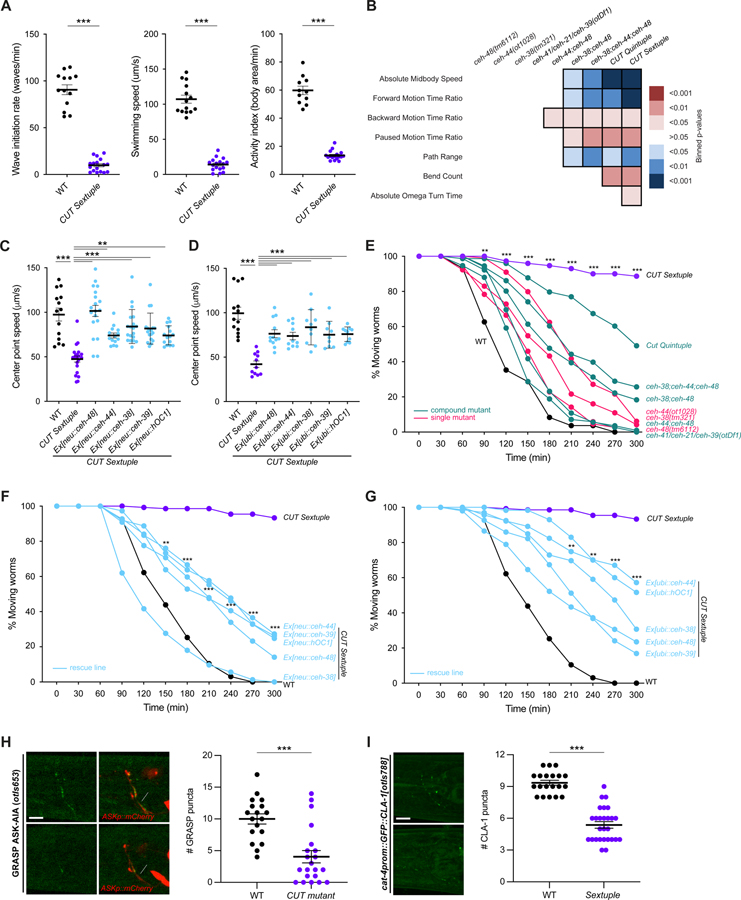
Figure 4. CUT genes are required for proper neuronal function.
(A) Swimming behavior: wave initiation rate (left), swimming speed (center), and activity index (right) were compared between wild-type and CUT sextuple mutant using a multi-worm tracker system 46. The data are presented as individual values with each dot representing the value of one worm with the mean ± SEM indicated. Unpaired t-test, ***P < 0.001. n ≥ 11 for all genotypes.
(B) Behavioral phenotypic summaries of representative locomotion features for individual and compound CUT mutants, analyzed using an automated worm tracker system 47. Heat map colors indicate the p-value for each feature for the comparison between each of the mutant strains and the wild-type strain. Red indicates a significant increase for the tested feature, while blue indicates a significant decrease. One-way ANOVA followed by Tukey’s multiple comparisons test. n ≥ 10 for all genotypes. Time ratio = (total time spent performing behavior)/(total assay time).
(C-D) Worm speed was compared between wild-type, CUT sextuple mutant, and CUT sextuple mutant rescue (panneuronal, ceh-48 promoter (“neu”, see Figure S4) (C), or ubiquitous, eft-3 promoter (“ubi”) (D), expression of ceh-48, ceh-44, ceh-38, ceh-39 or hOC1) using a multi-worm tracker system 46. The data are presented as individual values with each dot representing the value of one worm with the mean ± SEM indicated. Wild-type data is represented with black dots, the sextuple CUT mutant with purple dots, and rescue lines with blue dots. One-way ANOVA followed by Tukey’s multiple comparisons test, comparisons with CUT sextuple mutant indicated; **P < 0.01, ***P < 0.001. n ≥ 10 for all genotypes. See Figure S4 for additional locomotion features.
(E) Aldicarb-sensitivity defects in individual CUT mutants (ceh-48(tm6112), ceh-44(ot1028), ceh-38(tm321)) and compound CUT mutants (otDf1, which deletes ceh-41, ceh-21 and ceh-39; double ceh-44;ceh-48, double ceh-38;ceh-48, triple ceh-38;ceh-44;ceh-48, quintuple ceh-38;ceh-48;otDf1, and sextuple ceh-38;ceh-44;ceh-48;otDf1) compared to wild-type animals. Aldicarb is an acetylcholinesterase inhibitor that paralyzes worms. Decreased sensitivity to aldicarb correlates with a reduction in synaptic transmission 48. Worms were tested every 30 min for paralysis by touching the head and tail three times each. The data are presented as the percentage of moving worms at the indicated time point, dots represent the mean of independent experiments for each genotype. Wild-type data is represented with black dots, individual CUT mutants with pink dots, the sextuple CUT mutant with purple dots, and other compound CUT mutants with green dots. Two-way ANOVA followed by Tukey’s multiple comparisons test, comparisons for wild-type vs CUT sextuple mutant indicated; **P < 0.01, ***P < 0.001. n ≥ 3 independent experiments (25 animals per independent experiment). Mean and SEM values are provided in Data S5B.
(F-G) Aldicarb-sensitivity defects in wild-type animals, CUT sextuple mutant, and CUT sextuple mutant rescue lines (pan-neuronal (F), or ubiquitous (G) rescue lines). Wild-type data is represented with black dots, the sextuple CUT mutant with purple dots, and rescue lines with blue dots. Two-way ANOVA followed by Tukey’s multiple comparisons test, comparisons for CUT sextuple mutant vs Ex[neu::ceh-44] (F), and CUT sextuple mutant vs Ex[ubi::ceh-44] (G) indicated; **P < 0.01, ***P < 0.001. n ≥ 3 independent experiments (25 animals per independent experiment). Mean and SEM values are provided in Data S5B.
(H) ASK-AIA GRASP signal for the ASK>AIA (otIs653) in wild-type (top) and CUT compound mutant (ceh-38(tm321); ceh-44(ot1028); otDf1) (bottom). Lateral views of L1 worm heads at the nerve ring level are shown. ASK axon is labelled with cytoplasmic mCherry. Arrowheads indicate GRASP GFP synaptic puncta. otIs653 and ceh-48 are located in the same chromosome (chr. IV) and cannot be recombined together. Quantification of puncta along the ASK axon in the nerve ring. The data are presented as individual values with each dot representing the number of puncta in one worm with the mean ± SEM indicated. Unpaired t-test, ***P < 0.001. n ≥ 18 for all genotypes.
(I) HSN presynaptic specializations labeled by GFP-CLA-1 (cat-4prom::GFP::CLA-1[otIs788]) in wild-type (top) and CUT sextuple mutant (bottom). Lateral views of young adult worm heads at the nerve ring level are shown. Arrowheads indicate CLA-1 presynaptic specializations. Quantification of CLA-1 puncta along the HSN axon in the nerve ring. The data are presented as individual values with each dot representing the number of puncta in one worm with the mean ± SEM indicated. Unpaired t-test, ***P < 0.001. n ≥ 20 for all genotypes. See Figure S3 for overall nervous system anatomy.
WT, wild-type; Scale bars 5 μm.

