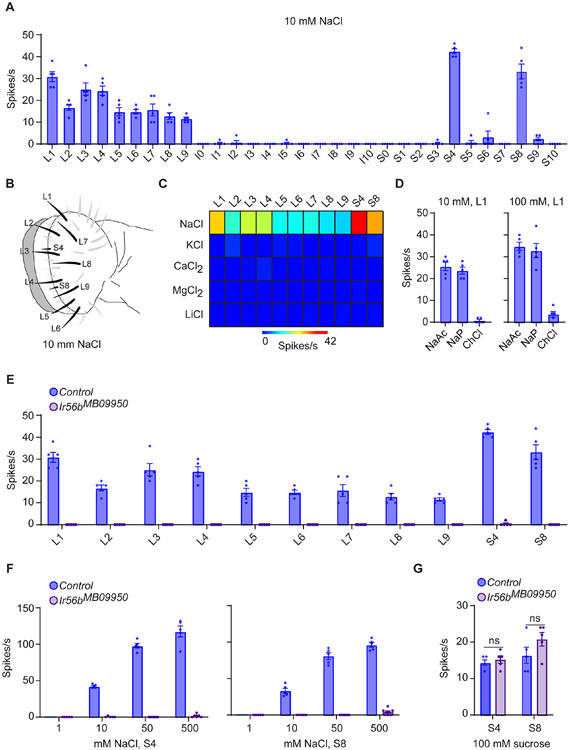
Figure 1. Response of labellar taste sensilla to salt.
(A) Responses of labellar sensilla to 10 mM NaCl, n = 5. Error bars are S.E.M. and are too small to be seen in some cases.
(B) Map of labellum; the labeled sensilla respond to 10 mM NaCl.
(C) Heatmap of responses of sensilla to salts, each tested at 10 mM. n = 5.
(D) Responses of L1 to other sodium and chloride salts. n = 5.
(E) Responses to 10 mM NaCl in control and Ir56bMB09950 flies. Mann-Whitney test; n =5. Values for control and mutant flies were measured in parallel; the control values are also shown in Figure 1A.
(F) Responses of S4 and S8 to NaCl. Mann-Whitney test; n = 5. The values for control flies to 10 mM NaCl are from Figure 1E.
(G) Responses of S4 and S8 to 100 mM sucrose. Mann-Whitney test; n = 5.

