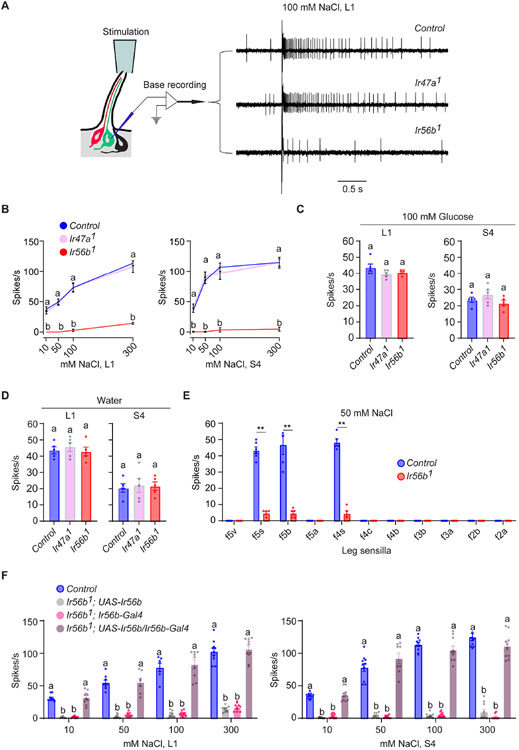
Figure 2. Ir56b is required for salt sensing.
(A) Left, "base recording" electrophysiological method. Right, sample traces of recordings from L1. Control is w Canton-S (w CS).
(B) Responses to NaCl. One-way ANOVA followed by Tukey’s multiple comparison test; n = 5. Values indicated with different letters are significantly different. "a" applies to both Ir47a1 and Ir56b1. Control is w CS.
(C) Responses of L1 and S4 in control, Ir47a1, and Ir56b1 to 100 mM glucose. One-way ANOVA followed by Tukey’s multiple comparison test; n = 5. Error bars = S.E.M.
(D) Responses to water. One-way ANOVA followed by followed by Tukey’s multiple comparison test; n = 5.
(E) Responses of tarsal sensilla on leg to 50 mM NaCl. Mann-Whitney test; n = 5-6. **p<0.01.
(F) Responses of L1 and S4 in the indicated genotypes to NaCl. One-way ANOVA followed by Tukey’s multiple comparison test; n = 5. Values indicated with different letters are significantly different.

