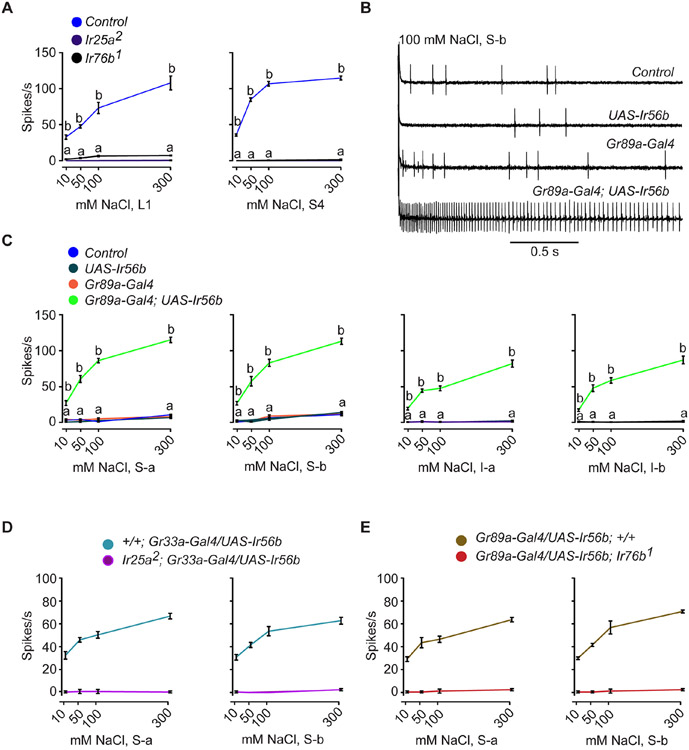
Figure 3. Misexpression of Ir56b confers salt sensitivity to bitter neurons.
(A) Responses of L1 and S4 in control w Canton-S (w CS), Ir25a2, and Ir76b1 to NaCl. One-way ANOVA followed by Tukey’s multiple comparison test; n = 5. Values indicated with different letters are significantly different. Measurements were taken for all concentrations; values equal to zero are not visible as points. Error bars are S.E.M. and are too small to be seen in some cases. The values for control were from Figure 2B.
(B) Sample traces from L1 in the indicated genotypes presented with 100 mM NaCl. Control = w CS.
(C) Responses of the indicated classes of bitter neurons in the indicated genotypes to NaCl. Control = w CS. One-way ANOVA followed by Tukey’s multiple comparison test; n = 5. Values indicated with different letters are significantly different. "a" applies to all three of the control genotypes.
(D) Salt responses of S-a and S-b bitter neurons that ectopically express Ir56b in an Ir25a mutant. Gr33a-Gal4, rather than the Gr89a-Gal4 driver, was used to drive expression in the bitter neuron because the Gr89a-Gal4 insertion is located on the same chromosome as Ir25a2.
(E) Salt responses of S-a and S-b bitter neurons that ectopically express Ir56b in an Ir76b mutant.

