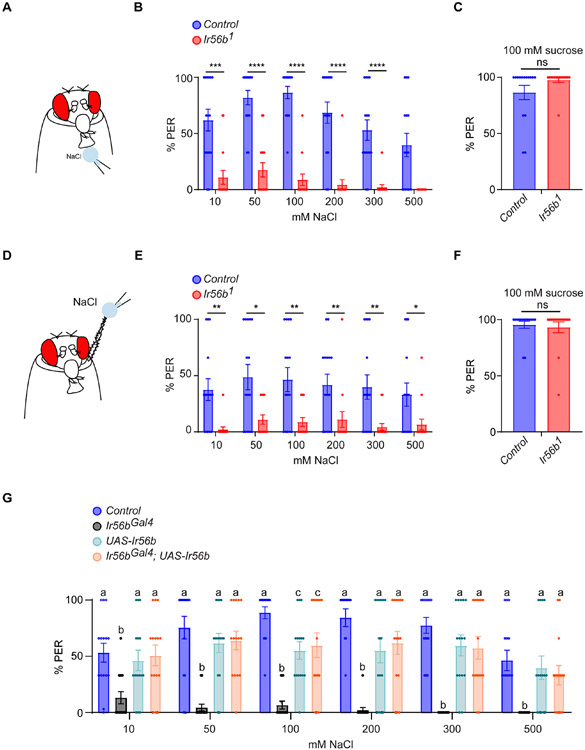
Figure 5. Ir56b is required for appetitive behavioral responses to NaCl.
(A) The labellar PER assay. A NaCl stimulus is presented to the labellum; the percentage of stimulus presentations that produce a proboscis extension is indicated.
(B) Labellar PER responses in control and Ir56b1 to NaCl. Mann-Whitney test; n =15. Error bars = S.E.M.
(C) Labellar PER responses to 100 mM sucrose. Mann-Whitney test; n =15.
(D) Leg PER assay. The stimulus is presented to the tarsal segments of the foreleg.
(E) Leg PER responses to NaCl. Mann-Whitney test; n =15.
(F) Leg PER responses in control and Ir56b1 to 100 mM sucrose. Mann-Whitney test; n =15.
(G) Labellar PER responses to NaCl in the indicated genotypes. One-way ANOVA followed by Tukey’s multiple comparison test; n = 15. Values indicated with different letters are significantly different. See also Table S2.

