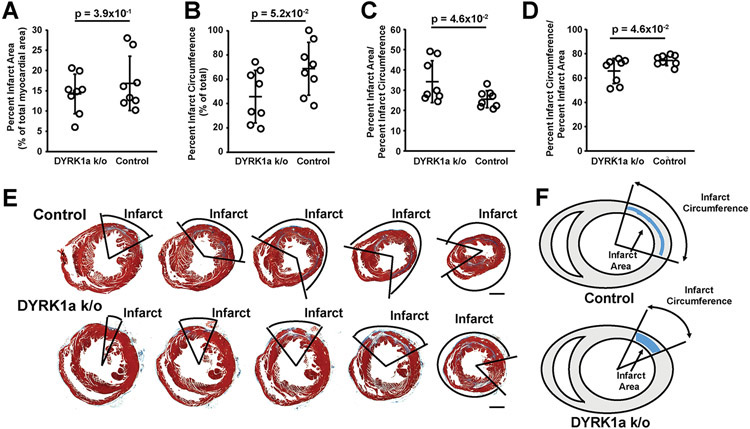
Figure 6. The cardiomyocyte-specific ablation of DYRK1a altered infarct parameters.
(A) Percent infarct area for αMHC-Cre::Fucci2aR (Control) and αMHC-Cre::Fucci2aR::DYRK1aflox/flox (DYRK1a k/o) animals corresponding to Figure 5. Open circles are values for individual animals. Bars are group means ± SD. p=3.9x10⁻¹ for the percent infarct area between αMHC-Cre::Fucci2aR and αMHC-Cre::Fucci2aR::DYRK1aflox/flox animals. p-values were calculated by student’s t-test. N = 8 animals per group. (B) Percent circumference of the infarct for αMHC-Cre::Fucci2aR and αMHC-Cre::Fucci2aR::DYRK1aflox/flox animals corresponding to Figure 5. Open circles are values for individual animals. Bars are group means ± SD. p=5.2x10⁻² for the percent circumference of the infarct between αMHC-Cre::Fucci2aR and αMHC-Cre::Fucci2aR::DYRK1aflox/flox animals. p-value were calculated by student’s t-test. N = 8 animals per group. (C) Ratio of the percent infarct area to percent circumference of the infarct for αMHC-Cre::Fucci2aR and αMHC-Cre::Fucci2aR::DYRK1aflox/flox animals corresponding to Figure 5. Open circles are values for individual animals. Bars are group means ± SD. P=4.6x10⁻² for percent infarct area to percent circumference of the infarct between αMHC-Cre::Fucci2aR and αMHC-Cre::Fucci2aR::DYRK1aflox/flox animals. p-value were calculated by student’s t-test. N = 8 animals per group. (D) Ratio of the percent circumference of the infarct to percent infarct area for αMHC-Cre::Fucci2aR and αMHC-Cre::Fucci2aR::DYRK1aflox/flox animals corresponding to Figure 5. Open circles are values for individual animals. Bars are group means ± SD. P=4.6x10⁻² for percent infarct area to percent circumference of the infarct between αMHC-Cre::Fucci2aR and αMHC-Cre::Fucci2aR::DYRK1aflox/flox animals. p-value were calculated by student’s t-test. N = 8 animals per group. (E) Representative short axis base to apex sections of hearts from αMHC-Cre::Fucci2aR and αMHC-Cre::Fucci2aR::DYRK1aflox/flox animals four weeks after I/R MI. Hearts were stained with Masson trichrome. Infarcted areas are shown. (F) Representations of the infarct area and circumference of αMHC-Cre::Fucci2aR and αMHC-Cre::Fucci2aR::DYRK1aflox/flox animals four weeks after I/R MI.

