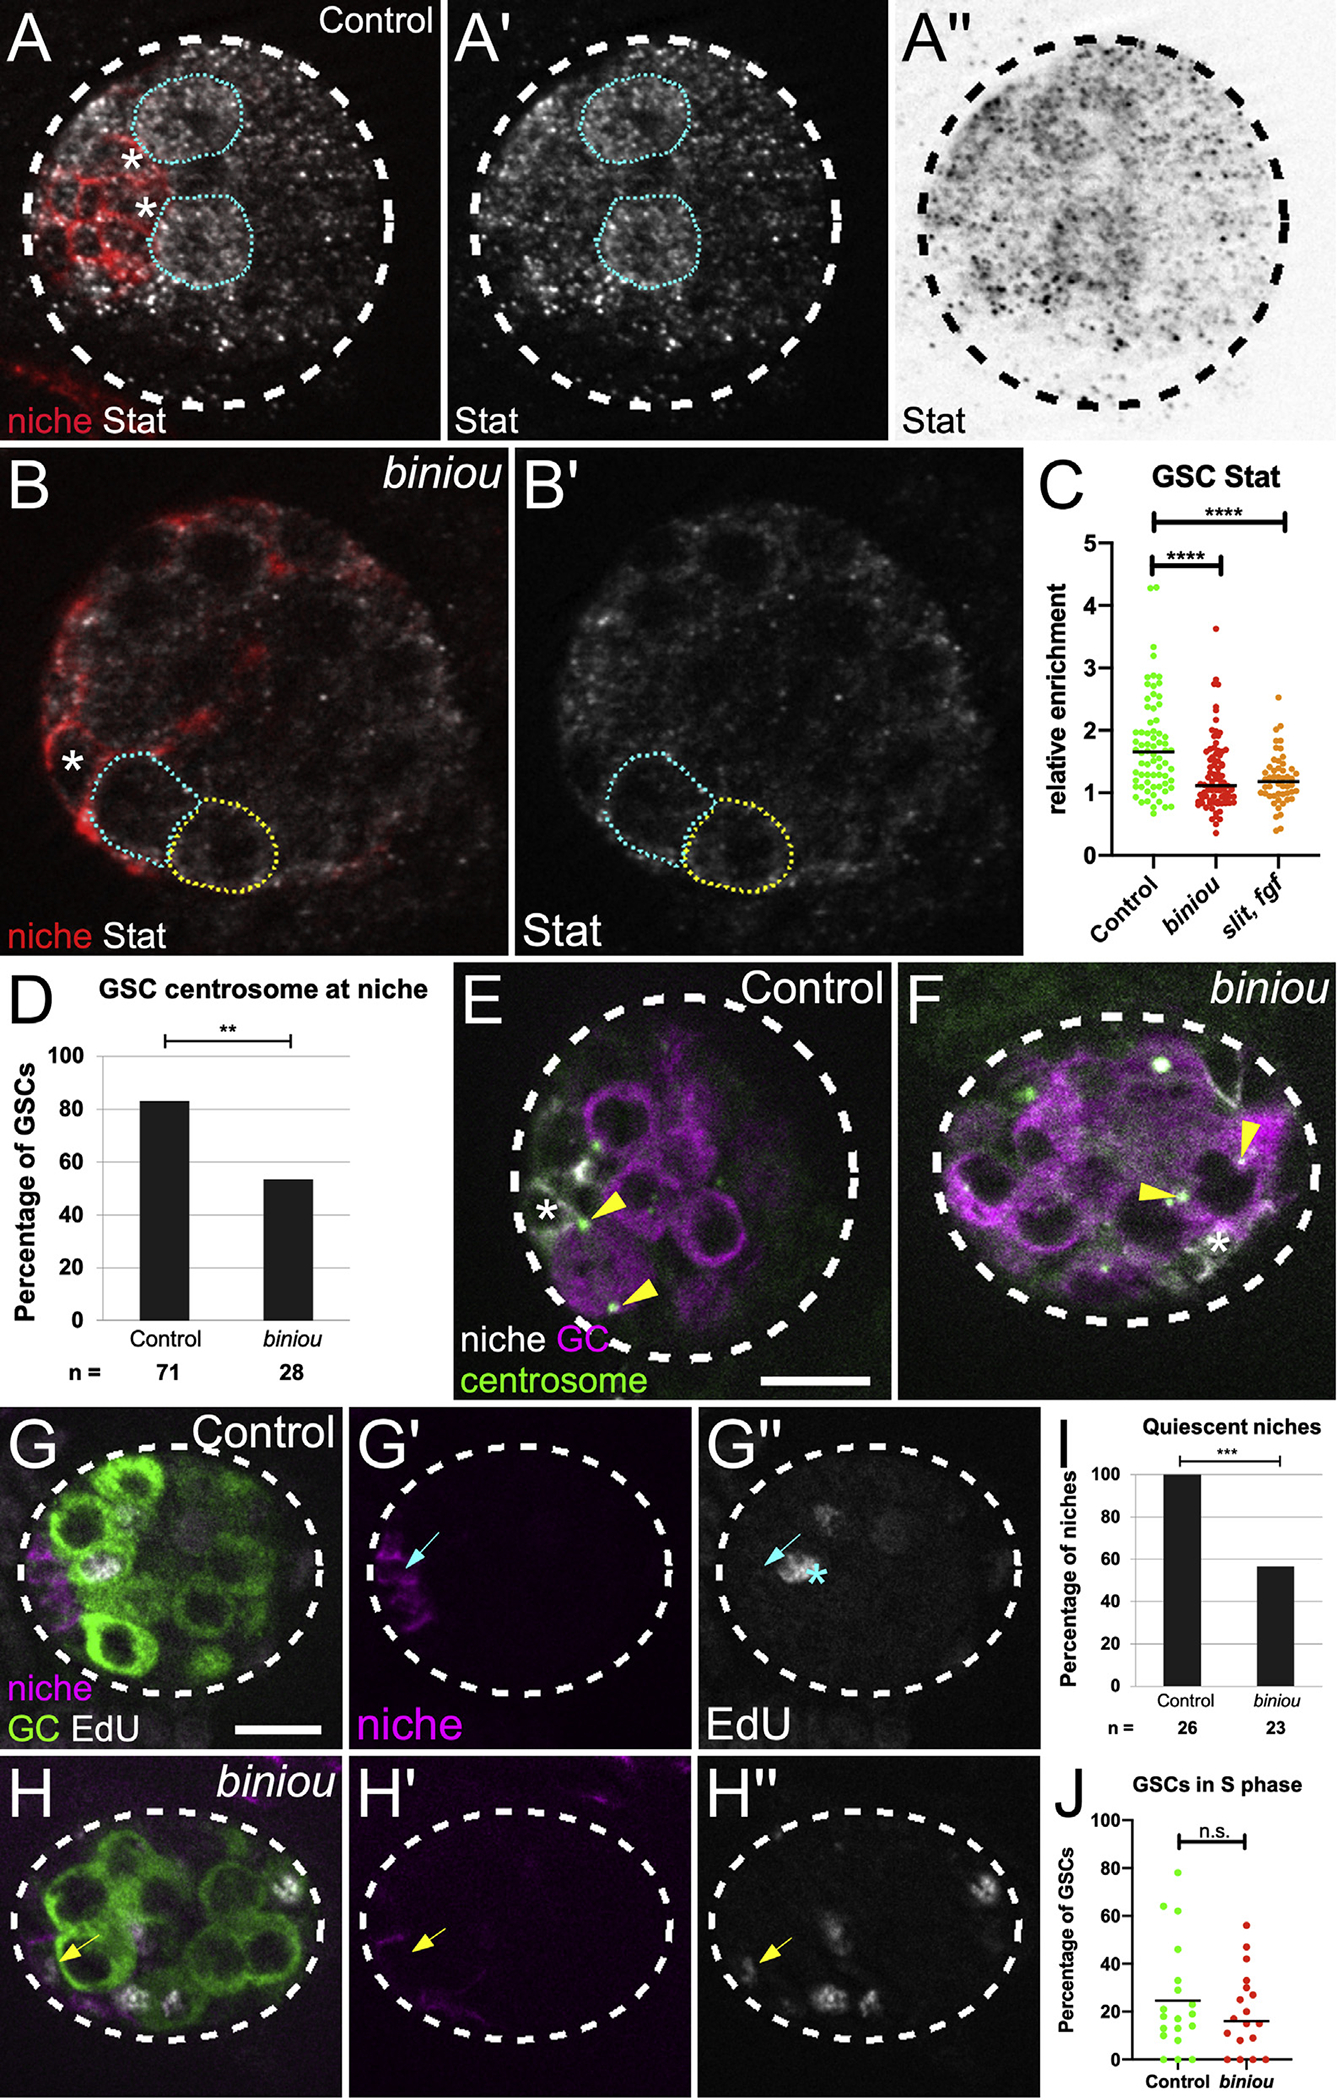
Figure 6. Niche assembly is required for niche function.

(A and B) Stage 17 gonad, Stat (white), Fas3 (red, niche cells), and Vasa (germ cells; not shown). Niche cell, asterisk; GSCs, blue dotted line; neighboring germ cells, yellow-dotted line. (A′ and B′) Stat alone. (A″) inverted Stat.
(C) Stat accumulation in GSCs relative to neighboring germ cells in control, biniou or combined signaling mutant (slit, pyr, and ths).
(D) Quantification of control versus biniou mutants for percentage of GSCs with a centrosome at a GSC-niche interface (p = 0.004, Fisher’s exact test).
(E and F) Stage 17 gonad, γ-tubulin (green, centrosomes), Fas3 (white, niche cells), and Vasa (magenta, germ cells). Arrowheads, GSC centrosomes; asterisk, adjacent niche cell.
(G and H) Stage 17 gonads pulsed with EdU, fixed and immunostained. Merge shows EdU (white), Fas3 (magenta, niche), and Vasa (green, germ cell), along with single channel Fas3 (G′ and H′), and EdU (G″ and H″). (G′) Control niche cell with no EdU incorporation (blue arrow), and (H′) a biniou mutant niche cell incorporating EdU (yellow arrow). Asterisk, S phase GSC.
(I and J) Quantification of control versus biniou mutants for: (I) percentage of gonads with quiescent niches (p = 0.0001, Fisher’s exact test); (J) S-phase index of GSCs. Scale bars, 10 μm.
