

Abstract
BACKGROUND:
Obesity increases the risk for human abdominal aortic aneurysms (AAA) and enhances angiotensin II (AngII)-induced AAA formation in C57BL/6J mice. Obesity is also associated with increases in perivascular fat that expresses pro-inflammatory markers including serum amyloid A (SAA). We previously reported that deficiency of SAA significantly reduces AngII-induced inflammation and AAA in hyperlipidemic apoE-deficient mice. In this study we investigated whether adipose tissue-derived SAA plays a role in AngII-induced AAA in obese C57BL/6J mice.
METHODS:
The development of AAA was compared between male C57BL/6J mice (WT), C57BL/6J mice lacking SAA1.1, SAA2.1, and SAA3 (TKO); and TKO mice harboring a doxycycline-inducible, adipocyte-specific SAA1.1 transgene (TKO-Tgfat; SAA expressed only in fat). All mice were fed an obesogenic diet and doxycycline to induce SAA transgene expression, and infused with AngII to induce AAA.
RESULTS:
In response to AngII infusion, SAA expression was significantly increased in perivascular fat of obese C57BL/6J mice. Maximal luminal diameters of the abdominal aorta were determined by ultrasound before and after AngII infusion, which indicated a significant increase in aortic luminal diameters in WT and TKO-TGfat mice but not in TKO mice. Adipocyte-specific SAA expression was associated with matrix metalloproteinase (MMP) activity and macrophage infiltration in abdominal aortas of AngII-infused obese mice.
CONCLUSIONS:
We demonstrate for the first time that SAA deficiency protects obese C57BL/6J mice from AngII-induced AAA. SAA expression only in adipocytes is sufficient to cause AAA in obese mice infused with AngII.
Keywords: Serum amyloid A, Abdominal aortic aneurysm, obesity and perivascular adipose tissue
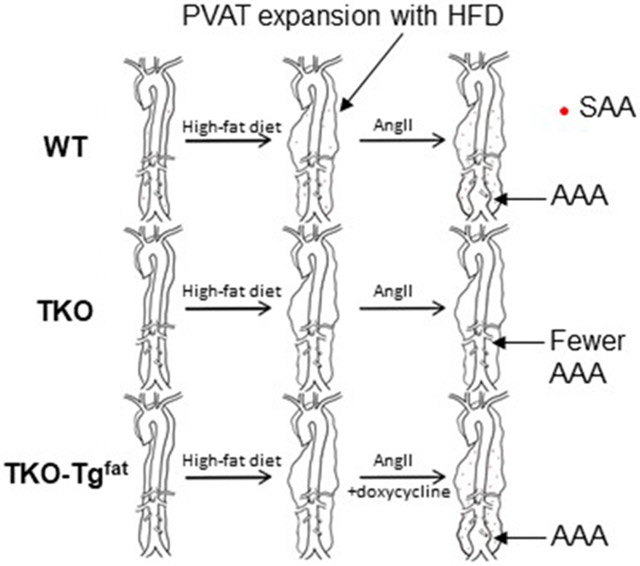
Graphical Abstract
INTRODUCTION
Abdominal aortic aneurysms (AAA) are a vascular disease that affects 4-9% of the adult male population and accounts for at least 15,000 deaths per year in the United States alone.1 The disease is typically asymptomatic, and its first presentation may be catastrophic rupture with high mortality. Unfortunately, despite decades of research, there are no treatments for this disease other than surgical procedures to replace or reinforce the dilated aortic segment.2 Therefore, it is crucial to elucidate the mechanisms involved in the development and progression of the disease.
AAA has been classified as a vascular matrix degenerative disease that involves the dilation and thinning of the artery wall in the abdominal segment of the aorta.3, 4 Macrophage infiltration, inflammatory cytokine release and matrix metalloproteinase (MMP) activation are thought to be important factors resulting in the medial injury and adventitial inflammation ultimately leading to the aneurysmal dilation of the aorta in AAA.5, 6 Population based studies indicate an association between AAA formation and increased body weight.7, 8 Obesity increases the risk of cardiovascular related mortality and is a risk factor for the development of AAA in humans9 as well as in mice.10 Although the link between obesity and AAA is known, the molecular and cellular mechanisms for this link are poorly understood. There is a significant amount of perivascular adipose tissue (PVAT) accumulation surrounding the aorta, and the incidence of AAA correlates to the quantity of PVAT.11 PVAT is believed to regulate vascular biology in paracrine ways due to its anatomical proximity to the vascular wall.12 PVAT expands in obesity and can interact with inflammatory cells and vascular cells to promote vascular diseases.13
Many laboratories have shown that infusion of angiotensin II (AngII) to hypercholesterolemic mice results in AAA formation.14, 15 Male sex and obesity are risk factors for human AAA, as well as for AngII-induced AAA in mice.10, 16, 17 Mice with either diet-induced or genetic obesity exhibited markedly increased inflammation in PVAT surrounding abdominal aortas and enhanced AAA formation in an AngII-induced AAA.10 Obesity-driven AAA in this model was independent of serum cholesterol concentrations, lipoprotein distributions, changes in insulin sensitivity, and blood pressure responses to AngII.10 In contrast, regional differences in peri-aortic adipocytes and their differential ability to promote chemokine release, macrophage infiltration and pro-inflammatory cytokine expression was related to enhanced AAA risk in obesity.10
Acute phase serum amyloid A (SAA) is a family of secreted proteins whose concentration in the plasma increases 1000-fold or more during a systemic inflammatory response. SAA is also persistently elevated in chronic inflammatory conditions such as diabetes,18, 19 obesity,18, 20 rheumatoid arthritis,21 and others. The acute phase SAAs include SAA1 and SAA2 (SAA1.1 and SAA2.1 in mice), and in mice but not humans, SAA3 is an acute phase SAA22 (in humans the SAA3 gene encodes a premature stop codon and is not expressed). A wealth of epidemiological data links SAA with cardiovascular disease and increased SAA is associated with cardiovascular disease mortality.3, 23-25 While the liver is the major source of SAA during an acute phase response, SAA may also be produced in adipose tissues and its expression increases with obesity and decreases with weight loss.26 Indeed, adipocytes are thought to be a predominant source of local and even systemic SAA in the setting of obesity.20, 26 The increased expression of SAA by adipocytes in obesity potentially acts as a direct link between obesity and its comorbidities, including diabetes and cardiovascular diseases.20 The goal of the current study was to determine if the expression of SAA in adipose tissue contributes to the increased AAA observed in obesity.
MATERIALS AND METHODS
The data that support the findings of this study are available from the corresponding author upon reasonable request. Details on animals and antibodies are provided in the Major Resource Table.
Animals
All mice used in this study are in the C57BL/6J background. Mice deficient in SAA1.1, SAA2.1 and SAA3 (TKO) were generously provided by Drs. June-Yong Lee and Dan Littman, New York University.27, 28 SAA transgenic mice encoding an SAA transgene regulated by a tetracycline-responsive promoter were generously provided by Dr. Paul Simon (University College London),29 and crossed with TKO mice. The transgenic mice in the TKO background were then crossed with mice expressing reverse tetracycline-controlled transactivator (rtTA) under control of the adipocyte-specific adiponectin promoter30 (AP-rtTA; gift from Dr. Philip Scherer, University of Texas Southwestern Medical Center), which were also previously bred to the TKO background. Thus, the resulting strain (designated TKO-Tgfat) exhibit highly inducible SAA expression only in adipose tissues upon administration of doxycycline. Littermate AP-rtTA mice lacking the SAA transgene are designated “TKO” for simplicity throughout the text. All procedures involving animals were approved by the Institutional Animal Care and Use Committees at the University of Kentucky and/or the Lexington Veterans Affairs Medical Center.
Animal Treatments
12-15 week-old male C57BL/6J mice (WT), TKO and TKO-TGfat mice were fed an obesogenic diet (60% kcal from fat; D12492, Research diets) for 12 or 14 weeks, as indicated. For the 14-week AAA study, mice (n=12-15/genotype) were provided water containing 0.4 mg/ml doxycycline (Sigma D 9891) and 5% sucrose ad libitum for the last 6 weeks to induce SAA transgene expression. All experiments were performed on male mice as they develop aneurysms at a significantly higher incidence than female mice, similar to the clinical observation that AAAs predominantly affect men.31 The mice were infused with AngII (1000 ng/kg/min; 4006473, BACHEM) via Alzet osmotic minipumps (model 2004; Durect Corporation) for the last 4 weeks to induce AAA. Body weight was measured weekly and body composition was measured by NMR spectroscopy (Echo MRI). All mice that died during the course of AngII infusion underwent necropsy to confirm that cause of death was due to aortic rupture.
Quantification of AAA
Ultrasound measurements were performed in mice before and after 28 days of AngII infusion. Abdominal aortas were visualized in mice anesthetized with 2% v/v Isofluorane with medical grade oxygen (Butler Schein) using high frequency ultrasound (US) (Vevo 660; VisualSonics) as described previously.32 Briefly, anesthetized mice were restrained in a supine position for ultrasonography, and short axis scans of abdominal aortas from the level of the left renal arterial branch moving vertically to the suprarenal region were obtained. Cine loops of 100 frames were acquired throughout the renal region of abdominal aortas. Maximal luminal diameter and area measurements were determined by two different observers blinded to groups. AAA incidence in treatment groups was defined as the sum of the number of mice that died from aortic rupture plus the number of mice that showed 50% or greater increase in maximal luminal diameter of the abdominal aorta after 28-day AngII infusion compared to baseline.
Human Magnetic Resonance Imaging (MRI)
MRI of the visceral cavity of lean and obese individuals (anonymized images; IRB exempt) were visualized by T1 weighed spoiled 3D gradient echo Dixon fat image with VIBE DIXON in an axial cut through the abdominal aorta.
Plasma SAA measurements
Plasma SAA concentrations were determined using a mouse SAA ELISA kit (cat no TP 802M, Tridelta Development Ltd).
Plasma cholesterol measurements
Plasma cholesterol concentrations were measured using enzymatic kits (Wako Chemicals).
Immunohistochemistry (IHC)
Immunohistochemistry was performed as described previously.33 Briefly, sequential paraffin-embedded sections of aortae (5 μm thick) were collected and mounted on microscope slides. Paraffin sections were deparaffinized and rehydrated through standard procedures. After antigen retrieval using Target Retrieval solution citrate buffer, pH6.0 (S2369, Dako) and quenching of endogenous peroxidase activity using 3% H2O2, sections were blocked in normal blocking serum which was prepared from the species in which the secondary antibody was made. After blocking endogenous biotin using Avidin/Biotin blocking kit (SP-Z001,Vector Laboratories), sections were incubated with rabbit anti-mouse SAA33 (1:500 dilution) overnight at 4°C, followed by biotinylated secondary antibody for 1 h at room temperature. Using ABC system (PK-6101,Vector Laboratories), and DAB detection system (K3468, Dako North America Inc), signals were detected. For immunofluorescence staining, aortae were frozen in Optimal Cutting Temperature compound (4583,OCT; Tissue-Tek) and 8 μm thick sections down the length of the aorta were mounted on glass slides. All tissue sections were subjected to identical processing at the same time to allow for direct comparison. Sections were fixed in 4% paraformaldehyde for 30 min and treated with 0.1% Triton X-100 in PBS for 15 min. After blocking in 1% BSA/PBS at room temperature for 2 hr, slides were incubated overnight at 4°C with a combination of rabbit anti-mouse SAA (1:200; ab199030, Abcam) and rat anti-mouse CD68 (1:200; ab53444, Abcam). After washes with PBS, SAA was detected using Alexa Fluor 568–labeled goat anti-rabbit IgG (1:200; A11011, Thermo Fischer Scientific) and CD68 was detected using Alexa Fluor 488–labeled goat anti-rat IgG (1:200; A11006, Thermo Fischer Scientific). Slides were mounted using fluorescence-protecting medium containing DAPI (Vectashield; Vector Laboratories). Images were captured by fluorescence microscopy (Nikon Eclipse 80i microscope, Nikon Instruments) and quantified using Nikon NIS-elements software.
For elastin staining, OCT-embedded sections were fixed in 10% formalin and treated according to manufacturer’s instructions (Elastic Stain Kit, HT25A1KT, Thermo Fisher Scientific). Images were captured on a Nikon ECLIPSE 80i microscope with the aid of NIS-Elements BR 4.00.08 software.
In situ zymography
In situ zymography was performed as described earlier.33 Briefly, OCT-embedded abdominal aorta sections, adjacent to those used for IHC (see above), were incubated with 20 μg/ml DQ gelatin fluorescein conjugate for 2 h at 37°C according to kit instructions (EnzChek Gelatinase/Collagenase Assay Kit, E-12055, Molecular Probes, Inc). The fluorescence generated by hydrolysis of the added substrate was recorded by an Olympus IX70 microscope equipped with Olympus DP70 digital camera. The general MMP inhibitor 1,10-phenanthroline, 20 mmol/L, was used to define non-specific fluorescence (33510, Sigma-Aldrich).
Adipocyte area measurement
Epididymal fat was collected and fixed in 10% formalin, paraffin embedded, cut into 5 μm sections, and stained with hematoxylin (Vector Laboratories, Burlingame, CA, USA). Average adipocyte area was determined from 4 randomly chosen frames from 4 adipose tissue sections of 4 mice of each group using Nikon NIS-elements software.
RNA isolation and quantitative RT-PCR
Total RNA was isolated from mouse adipose tissues according to the manufacturer’s instructions (RNeasy® Mini Kit, 74106, Qiagen). RNA samples were incubated with DNase I (79254, Qiagen) for 15 min at RT prior to reverse transcription. Adipose tissue RNA (0.5 μg) was reverse transcribed into cDNA using the Reverse Transcription System (4368814, Applied Biosystems). After 4-fold dilution, 5 μl was used as a template for real-time RT-PCR. Amplification was done for 40 cycles using Power SYBR Green PCR master Mix Kit (4367659, Applied Biosystems). Quantification of mRNA was performed using the ΔΔCT method and normalized to GAPDH. Primer sequences will be provided on request.
Western blotting
Liver and adipose tissue homogenates were prepared by homogenizing tissues (50-100 mg) in RIPA buffer (R0278,Sigma) containing protease inhibitor cocktail (88665,Thermo Fisher). Aliquots corresponding to 25 μg of protein were separated on a 4–20% polyacrylamide gradient gel (5671095, Bio-Rad) and immunoblotted with anti-SAA primary antibody (1 ng/ml, ab199030, Abcam). The secondary antibody (anti-rabbit antibody; 1:10,000 dilution; ab205718) was from Abcam. For loading controls, liver and adipose tissue lysates/membranes were immunoblotted with anti-β actin primary antibody (1 : 2000; Sigma, A5441) and anti-mouse secondary antibody (1:10,000 dilution; Sigma, A-4416).
Statistical analyses
Statistical analyses were performed using either SigmaPlot software (Version 14.0) or GraphPad Prism 8. Normality and homogeneous variation were tested in all continuous variables by Shapiro-Wilk and Brown-Forsythe tests, respectively. Since the non-repeated continuous data did not pass either test, all data were analyzed using non-parametric methods. For two-group comparisons, Mann-Whitney U test was performed. To compare multiple groups, Kruskal-Wallis one-way ANOVA on Ranks followed by Dunn’s method was used. For multiple groups with repeated measures, two-way repeated measures ANOVA followed by Bonferroni post hoc analysis. For multiple groups with two factors, two-way ANOVA with Sidak multiple comparisons test was used. P < 0.05 was considered statistically significant. Fisher’s exact test was applied to the comparisons of AAA incidence.
RESULTS
Perivascular adipose tissue is increased in obesity and expresses SAA
MRI of the abdomen of humans shows negligible adipose tissue mass surrounding the aorta of a lean individual, however there is considerable accumulation of adipose tissues surrounding the aorta of an obese individual (Figure 1A). Notably, PVAT mass of C57BL/6J mice fed an obesogenic diet for 12 weeks was significantly heavier than that of mice fed a standard diet for the same period of time (Figure S1), consistent with previous reports addressing the impact of an obesogenic diet on PVAT mass in mice.13 PVAT from obese C57BL/6J mice infused either with saline or AngII for 28 days was analyzed for SAA expression by IHC and qRT-PCR. SAA immunostaining was more pronounced in the PVAT surrounding the abdominal aortas of AngII-infused mice compared to saline-infused controls (Figure 1B), and there was a significant 4.5-fold increase in SAA1.1/2.1 mRNA abundance in the PVAT of obese mice infused with AngII compared to saline (Figure 1C). There was a ~ 3-fold increase in SAA3 mRNA abundance in the PVAT of obese mice infused with AngII compared to saline (Figure 1C). Thus, one consequence of AngII infusion in obese mice is an increase in SAA expression in PVAT surrounding the abdominal aorta, a region susceptible to dilation and AAA formation.
Figure1.

Perivascular fat is increased in obesity and expresses SAA. (A) Cross-section MRI images of the visceral cavity reveals profound increase in adipose tissue mass surrounding the aorta (*aorta) in obese compared to lean individual. Peri-aortic fat is indicated by the arrows. The panel on the left is from a 51 year old male weighing 65.6 kg and the right panel from a 51 year old male weighing 135 kg. (B) SAA immunostaining in perivascular tissue in obese C57BL/6J male mice infused with saline or AngII, shown at 4x (upper panel), scale bar = 200 μm and 20x (lower panel), scale bar = 50 μm. The imageses are representative of three sections from two mice treated with either saline or AngII (C) SAA 1.1/2.1 and SAA3 mRNA abundance in perivascular adipose tissue from saline and AngII-infused obese mice (n=3-6 mice/group). Data are mean ±SEM; Statistical tests used: Mann-Whitney test.
TKO-Tgfat mice exhibit adipose tissue-specific SAA expression
To investigate whether adipose-derived SAA contributes to the formation of AAA, transgenic mice expressing SAA only in adipose tissue when given doxycycline in the drinking water were generated as described in Materials and Methods (TKO-Tgfat mice). Littermate mice lacking the SAA transgene and also administered doxycycline were used as control in our studies (TKO mice). Male C57BL/6J (WT), TKO, and TKO-Tgfat mice were fed an obesogenic diet for 14 weeks to induce obesity. All mice were given doxycycline (0.4 mg/ml) in drinking water during the last 6 weeks of obesogenic diet and infused with AngII (1000 ng/kg/min) during the last 4 weeks (starting 2 weeks after the doxycycline treatment; Fig. 2A). At the end of the study, SAA1.1 expression was significantly higher in PVAT of TKO-Tgfat mice compared to WT (Figure 2B). Consistent with lack of endogenous SAAs in TKO mice, SAA3 mRNA was only detected in PVAT from WT mice (Figure 2B). SAA1.1 expression was also significantly increased in other adipose tissue depots of TKO-Tgfat mice compared to WT mice (expression in gonadal adipose tissues shown in Figure S2). Immunoblot analysis of adipose and liver extracts confirmed SAA protein expression in adipose tissues, but not liver, of TKO-Tgfat mice (Figure 2C). In WT mice, relatively modest SAA expression was detected in both adipose tissue and liver as expected (Figure 2C). Plasma SAA levels were significantly higher in the WT mice compared to TKO-Tgfat mice (113 ± 22 μg/ml vs 27.6 ± 6 μg/ml; Figure 2D), despite higher adipose tissue SAA expression in TKO-Tgfat mice (compare Figure 2B and 2C with 2D). As expected, SAA was not detected in the adipose tissues, liver or plasma of TKO mice (Figure 2C and D). Taken together, our results suggest that relative to WT mice which express moderate amounts of SAA in both hepatic and adipose tissues, TKO-Tgfat mice express SAA only in adipose tissue, which despite very high levels does not significantly contribute to the systemic pool.
Figure 2.

TKO-TgFat mice exhibit adipose tissue-specific SAA expression. (A) Study design: three groups of 12-15 weeks old male mice (WT, TKO and TKO-TgFat) were fed obesogenic diet (HFD) for a total of 14 weeks. For the last 6 weeks all mice were given doxycycline-supplemented water (0.4 mg/ml in 5% sucrose water) to induce transgenic fat-specific overexpression of SAA1.1 in TKO-TgFat mice. All mice were infused with AngII (1000 ng/kg bodyweight/min) for the last 4 weeks and mice were killed at the end of 14 weeks. (B) SAA1.1 and SAA3 mRNA abundance in peri-aortic adipose tissues from AngII-infused obese WT, TKO and TKO-Tgfat mice. (C) Adipose tissue and liver lysates (50 μg protein/lane) obtained from obese WT, TKO, and TKO-Tgfat mice at the end of the study were immunoblotted for SAA (top panel) and β-actin as loading control (bottom panel). +C is a positive control of 44 ng lipid-free SAA. (D) SAA levels in plasma collected from AngII-infused obese WT, TKO, and TKO-Tgfat mice were determined by ELISA. Data are mean ±SEM. Statistical tests used: Mann-Whitney test for (B); Kruskal-Wallis test (D).
Adipocyte-specific SAA overexpression in obese mice does not affect body weight, body composition, plasma cholesterol levels, or inflammatory markers compared to SAA-deficient mice
There was no significant difference in body weights between TKO and TKO-Tgfat mice during the 14-week study. However, the WT mice gained less weight compared to TKO and TKO-Tgfat mice in response to obesogenic diet feeding (Figure 3A). Thus, in the TKO background, in the absence of endogenous SAA, the presence or absence of SAA in adipose tissues did not impact diet-induced weight gain. All groups lost weight following pump implantation as previously observed in the AngII infusion model,27 but weight loss did not differ amongst groups. Transgenic overexpression of SAA in adipose tissues did not significantly change percentage body fat mass (40.3 ± 1.0%) or lean mass (56.9 ± 0.9%) compared to TKO mice (39.2 ± 2.5 % fat and 58.0 ± 2.4 % lean) as determined by EchoMRI after 10 weeks of diet, although there was a modest but significant increase in percentage body fat content in both TKO mice and TKO-Tgfat mice compared to the WT mice (32.3 ± 1.3; Figure 3B). Average adipocyte size measured in gonadal adipose tissue was not significantly different among the three groups of mice, although there was a trend for decreased average adipocyte size in WT mice compared to TKO mice and TKO-Tgfat mice (Figure 3C). There were no apparent differences in the expression of UCP1 or perilipin1 protein, markers of brown/beige and white adipocytes respectively, in the adipose tissues of the three groups of mice (Figure S3A-C). Consistently, UCP-1 mRNA levels did not significantly differ among the adipose tissues of the three groups of mice (Figure S3D). Adipose tissue adiponectin and leptin mRNA expression levels were not significantly different amongst groups (Figure S3E and F). However, plasma adiponectin levels were significantly lower in TKO-Tgfat mice compared to WT and TKO mice (Figure S3G). Plasma leptin levels were not significantly different among the three groups of mice (Figure S3H). The expression of matrix metalloproteinases, MMP2, MMP9 and MMP12 (Figure S4A-C) as well as pro-inflammatory markers TNFα, IL1β, F4/80, MCP-1 and IL-6 and anti-inflammatory markers arginase and IL-10 mRNAs in PVAT were not significantly different among the three groups of mice (Figure S5A-G). Plasma IL-6 levels were also not significantly different for the three strains (Figure S5H). IL-1β and TNFα were undetectable in plasma of all groups. Plasma total cholesterol levels were not significantly different among the three strains of mice at the end of the study (Figure 3D).
Figure 3.

Adipocyte-specific SAA overexpression in obese mice does not affect body weight, body composition, adipocyte morphology or plasma cholesterol levels when compared to SAA-deficient mice. (A) Body weights during the course of obesogenic diet feeding. The arrow indicates the start of AngII infusion. Data are mean ±SEM; n=13-15; *= P ≤ 0.05 difference between WT and TKO-Tgfat; #= P ≤ 0.05 difference between WT and TKO; (B) Percentage of lean (filled) and fat (open) mass of the experimental mice after 8 weeks of obesogenic diet feeding as determined by EchoMRI. Data are mean ±SEM n=13-15. (C) HE stained sections from gonadal adipose tissue of WT, TKO and TKO-Tgfat, shown at 20x, scale bar = 50 μm. Average adipocyte area was determined from 4 randomly chosen frames from 4 adipose tissue sections of 4 mice of each group. (D) Plasma total cholesterol levels in individual mice after 10 weeks of obesogenic diet feeding and 2 weeks of doxycycline administration. Two-way repeated measures ANOVA followed by Bonferroni post hoc analysis was used for statistics in A; Kruskal-Wallis one-way ANOVA on Ranks followed by Dunn’s method and Sidak’s multiple comparison test were used in B and C respectively.
Adipocyte-derived SAA restores obesity-accelerated AAA in TKO mice
AAA incidence and severity was assessed in obese WT, TKO, and TKO-Tgfat mice infused with AngII for 28 days. Mice that died during the AngII infusion were necropsied to determine cause of death. The incidence of death due to aortic rupture was similar for all groups (2/14, 3/14 and 3/13 in WT, TKO and TKO-Tgfat mice respectively; Figure 4A), and all deaths were due to aortic rupture. AAA development was assessed in surviving mice by measuring the maximal luminal diameter of abdominal aortas before and after 28 days of AngII infusion using in vivo ultrasound. Before AngII infusion, luminal diameters were not significantly different in WT (1.18 ± 0.03 mm; n=14), TKO (1.14 ± 0.032 mm; n=14) and TKO-Tgfat (1.14 ± 0.04 mm; n=13) mice. AngII infusion led to a significant increase in diameter of the abdominal aorta in WT (1.51 ± 0.13; p<0.05) and TKO-Tgfat mice (1.52 ± 0.13; p<0.05) but not TKO mice (1.29 ± 0.07) (Figure 4B), indicating that deficiency of SAA protected against AAA development and that the expression of SAA only in adipose tissue was sufficient to restore AngII-induced AAA. The maximal external aortic diameter measured ex vivo had a similar trend and averaged 1.53 ± 0.15 mm, 1.30 ± 0.15 mm and 1.52 ± 0.21 mm for WT, TKO and TKO-Tgfat mice respectively. The overall AAA incidence, calculated as the sum of the number of mice that died from aortic rupture plus the number of mice showing more than 50% dilation in luminal diameter after 28-day AngII infusion, was lower in TKO mice (14.3%) compared to WT mice (28.6%) and TKO-Tgfat mice (53.8%; Fig. 4A) but did not reach statistical significance. The overall AAA incidence was 25% higher in TKO-Tgfat mice compared to the WT mice, however the difference was not statistically significant (Figure 4A). A representative image from each group is shown in Figure 4C (the maximal aortic luminal diameter of the representative mouse imaged in each group is indicated by the red circle in Figure 4B).
Figure 4.

Expression of SAA only in adipose tissues restores AngII-induced AAA in obese TKO mice. (A) Mice that died during the study due to aortic rupture are represented by the solid black sections of the bars; surviving mice that developed AAA, defined as a >50% increase in luminal diameter of the abdominal aorta, are indicated by the slashed region of the bars. (B) Abdominal aortas were assessed by in vivo ultrasound before (open symbols) and after AngII infusion (filled symbols) to determine maximal luminal diameters in individual mice. Data are mean ±SEM. (C) Representative ex vivo images of aortas from WT, TKO and TKO-Tgfat mice are shown. The maximal luminal diameter for the corresponding ex vivo images are shown by pink circles in (B). The maximal luminal diameter for the corresponding immunofluorescence images in Fig.5 are shown by green circles in (B). Fischer’s exact test was applied to the comparisons of AAA incidence in A; Statistical significance was evaluated using two-way ANOVA with Sidak multiple comparison test in B.
Adipocyte-specific SAA co-localizes with matrix metalloproteinase (MMP) activity and macrophage infiltration in abdominal aortas of AngII-infused obese mice
AAA tissue sections (the maximal aortic diameter of the mouse imaged in each group is indicated by the green circle in Figure 4B) were examined for elastin breaks, macrophage infiltration and MMP activity, well-documented features of AAA.34 Consistent with the presence or absence of AAA, AngII infusion resulted in elastin breaks in WT (Figure 5A, asterisk) and TKO-Tgfat (Figure 5C, asterisk) mice, but not in TKO mice (Figure 5B). In WT mice, regions containing elastin breaks were distinguished by intense MMP activity visualized by in situ zymography (green fluorescence) and prominent macrophage (green fluorescence) and SAA (red fluorescence) immunoreactivity. In addition to the medial region, SAA immunostaining was also detected to a lesser extent in periaortic fat of WT mice. In TKO-Tgfat mice, regions of elastin breaks similarly contained pronounced MMP activity and macrophage immunoreactivity (Figure 5C), but SAA immunoreactivity was detected mainly in the surrounding adipose tissue and not in the aortic wall (Figure 5C). MMP activity and macrophage immunostaining was less pronounced in TKO mice as expected, as there was not an AAA. Immunostaining with the anti-SAA antibody produced only faint and diffuse background reactivity in TKO mice, demonstrating the specificity of SAA immunostaining (Figure 5B).
Figure 5.

Expression of SAA only in adipocytes increases matrix metalloproteinase (MMP) activity and macrophages in the medial region of abdominal aortas in AngII-infused obese mice. Sections showing the AAA and surrounding perivascular fat from WT (A), TKO (B) and TKO-Tgfat (C) mice were processed as described in Methods to detect elastin fibers (black staining, elastin breaks are indicated by *), MMP activity (green fluorescence), macrophages (green fluorescence), and SAA (red fluorescence), as indicated. For in situ zymography and immunostaining, nuclei were identified using DAPI (blue fluorescence). Images photographed under 4× and 20× objective magnification are shown; scale bar in 4x image is 200 μm, scale bar in 20x image is 50 μm. For WT and TKO-Tgfat mice, eighteen sections from individual mouse (maximal luminal diameter of the corresponding mouse in each group is indicated by green circles in Fig. 4B) were processed to identify regions of elastin breaks; the corresponding region of the abdominal aorta from a representative TKO mouse is shown for comparison.
DISCUSSION
Identifying the mechanisms underlying AAA formation and progression is critical for the development of therapeutics that inhibit their expansion. Currently there is no effective drug therapy available for preventing aneurysm progression or rupture. Recent studies suggested that targeting dysfunctional adipose tissue surrounding the vascular wall might be a useful strategy to prevent AAA rupture.17 Excessive accumulation of inflamed, dysfunctional PVAT has been proposed to be a major risk factor for endothelial dysfunction and vascular diseases such as atherosclerosis and AAA.35
The current study expands results from our previous report that SAA is essential for the development of AngII-induced AAA formation in hyperlipidemic apoE−/− mice.33 The major findings of the present study are that obesity-accelerated AAA in normolipidemic mice is significantly reduced in the absence of total body SAA expression, and SAA expression only in adipose tissues is sufficient to trigger the development of AAA in the setting of obesity. Obesity generates a state of low-grade inflammation characterized by an increase in the infiltration of macrophages and inflammatory factors in adipose tissues.36-38 PVAT exhibits inflammation similar to other white adipose depots with obesity.10, 39, 40 Our study is consistent with other studies39, 40 in demonstrating that obesity increases the size of PVAT. Although SAA is thought to be primarily produced by the liver during an acute phase response, adipocytes become the predominant source of SAA with obesity,20, 26 and here we show that AngII infusion further increases SAA expression in periaortic adipose tissue of obese mice. In obese TKO-Tgfat mice that express SAA only in adipose tissues, plasma SAA levels were modest and did not reach the levels observed in obese WT mice after AngII infusion (Figure 2D). On the other hand, the expression of SAA in adipose tissues was dramatically higher in the TKO-Tgfat mice compared to the WT mice (Figure 2C). Thus, it appears that SAA expression in adipose tissue is sufficient to exacerbate the development of obesity-driven AAA. “However, while there was an ~80x increase in SAA1.1 levels in the PVAT of TKO-Tgfat mice compared to the WT mice, this increase did not produce an additional increase in aortic diameter (Figure 4B). The lack of further AAA expansion in TKO-Tgfat mice compared to WT may reflect either a threshold effect, or contributions of systemic SAA in WT mice on AAA progression in addition to adipose tissue-derived SAA.” Although a role for other adipose tissue depots cannot be ruled out, PVAT surrounding the abdominal aorta seems to be the most likely source of SAA that enhanced AAA in our studies, given the low levels of circulating SAA in obese TKO-Tgfat mice.
Whether liver-derived systemic SAA can act on the vasculature to exacerbate AAA requires further study. We have determined, for example, that one consequence of AngII infusion in hyperlipidemic mice is upregulation of SAA in the liver and increased plasma SAA. Ongoing studies in our laboratory are investigating whether liver-derived SAA is sufficient for AngII-induced AAA in hyperlipidemic mice.
Our data provides some insights into mechanisms by which SAA contributes to AngII-induced AAA in obese mice. There were no significant differences in plasma cholesterol in WT, TKO, and TKO-Tgfat mice, indicating that adipose-derived SAA’s effect on AAA was not driven by inducing hyperlipidemia. There were modest but significant differences in body weight gain and percentage fat between WT and TKO and between WT and TKO-Tgfat mice (Figure 3A and B); however TKO and TKO-Tgfat mice did not show any difference in body weight gain or fat content, despite the differences in AAA formation between these groups. SAA is known to promote inflammation by acting as a chemokine and by upregulating inflammatory mediators, including MMPs,41-44 that have been implicated in AAA.34 MMP activities, macrophages and elastin breaks appeared to be absent in abdominal aortas of AngII-infused TKO mice lacking SAA, whereas those were readily detectable in WT and transgenic mice with adipocyte-specific SAA expression (Figure 5). These data are in line with our previous study in hyperlipidemic mice.33 It is notable that the low rupture rate (~14-23%) was similar for the three strains of mice with AngII infusion, despite significantly increased dilation of the abdominal aorta of surviving WT and TKO-Tgfat mice compared to TKO mice at the end of the 28-day infusion (Figure 4A). Ex vivo observation of thoracic regions of the aortas in these mice did not indicate any overt differences in appearance among the three strains of mice. Further studies are needed to investigate the interesting possibility that SAA plays little/no role in the initiating events leading to AAA rupture, but contributes to pathological remodeling during AAA progression.
In TKO-Tgfat mice, SAA staining appeared to be visible primarily in PVAT surrounding AAA tissue, with little/no evidence of SAA in the media. Thus, the enhanced AAA formation in TKO-Tgfat mice does not appear to be the result of the direct action of SAA on vascular cells, but possibly by indirect signaling events triggered by adipocyte-derived SAA. In contrast, sections from WT mice revealed co-localization of SAA with macrophages in AAA tissue (Figure 5, panel A). Whether this SAA is deposited from the circulation or expressed by infiltrating macrophages is not currently known. The exact mechanism of how SAA in adipocytes signals to enhance macrophage infiltration and MMP activities in the adjacent aorta remains to be established. The increased MMP activity in obese TKO-Tgfat mice could be mediated at least in part by the increased macrophage content. In our earlier study27 in hyperlipidemic apoE-deficient mice, we showed that whole-body deficiency of SAA was associated with significantly blunted MMP-2 expression and activity in abdominal aortas of AngII-infused mice, and concluded that SAA mediates AngII-induced AAA in part by promoting elastin degradation.33 There was a significant reduction in plasma adiponectin levels in TKO-Tgfat compared to both WT and TKO mice consistent with the previous reports that there is an inverse relationship between SAA and adiponectin expression.45, 46 Adiponectin suppresses AAA formation in apoE-deficient hyperlipidemic mice.47 Whether adiponectin plays any role in SAA-mediated AAA formation in the current study needs to be investigated. There were no significant changes in adipocyte size and leptin levels amongst the groups of mice. It is unclear at this point whether the mechanisms by which SAA regulates hyperlipidemia-induced AAA are different or the same as that of obesity-induced AAA.
In summary, we demonstrated that TKO mice are strikingly protected against the development of AngII-induced AAA in obese mice, indicating that SAA is required for AAA formation in the setting of obesity. SAA expression only in adipose tissue, despite very low systemic circulating levels, is sufficient to induce AAA to a similar extent as seen in obese WT mice. This implies that SAA is exerting paracrine effects, and that the accumulation of perivascular fat in obesity may be a direct cause of AAA. Studies to evaluate whether the suppression of SAA either systemically, or in perivascular adipose tissues, can attenuate AAA progression are urgently needed.
Supplementary Material
HIGHLIGHTS.
Serum amyloid A (SAA) expression in adipose tissues increases in mice infused with angiotensin II (AngII).
Deficiency of all the inducible SAA isoforms protects obese mice from the development of AngII-induced abdominal aortic aneurysms (AAA).
Expression of SAA only in adipose tissues drives the development of AAA in obese C57BL/6J mice.
Adipose tissue-derived SAA augments the development of AAA, possibly by recruiting macrophages and increasing matrix metalloproteinase activity in the abdominal aorta.
ACKNOWLEDGEMENTS
We are grateful to Dr. Maria C de Beer for helpful discussions and support throughout the study.
SOURCES OF FUNDING
This work was supported by Department of Veterans Affairs BX004275 (to LT), National Institutes of Health Grants HL134731 (to NRW and FD) and HL147381 (to LT and PS), and Washington University Diabetes Research Center Collaborative Pilot and Feasibility Grant DK020579-42 (to PS). The studies were supported with resources and facilities provided by the Centers of Biomedical Research Excellence (COBRE) at the University of Kentucky, which was supported by an Institutional Development Award (IDeA) from the National Institute of General Medical Sciences of the National Institutes of Health under grant number P30 GM127211.
Nonstandard Abbreviations and Acronyms
- AAA
abdominal aortic aneurysm
- AngII
angiotensin II
- SAA
serum amyloid A
- PVAT
perivascular adipose tissue
- MMP
matrix metalloproteinase
- IHC
immunohistochemistry
Footnotes
Disclosures: None
Contributor Information
Preetha Shridas, The Department of Internal Medicine, Saha Cardiovascular Research Center, Barnstable Brown Diabetes Center, University of Kentucky, Lexington, Kentucky 40536.
Ailing Ji, The Department of Internal Medicine, University of Kentucky, Lexington, Kentucky 40536.
Andrea C Trumbauer, The Department of Saha Cardiovascular Research Center, University of Kentucky, Lexington, Kentucky 40536.
Victoria P Noffsinger, The Department of Internal Medicine, University of Kentucky, Lexington, Kentucky 40536.
Steve W Leung, The Department of Internal Medicine, Saha Cardiovascular Research Center, University of Kentucky, Lexington, Kentucky 40536.
Adam J. Dugan, The Department of Biostatistics, University of Kentucky, Lexington, Kentucky 40536
Sean E Thatcher, Department of Pharmacology, Temple University, Philadelphia, PA.
Lisa A Cassis, The Department of Pharmacology and Nutritional Sciences, University of Kentucky, Lexington, Kentucky 40536.
Frederick C De Beer, The Department of Internal Medicine, Saha Cardiovascular Research Center, Barnstable Brown Diabetes Center, University of Kentucky, Lexington, Kentucky 40536.
Nancy R Webb, The Department of Pharmacology and Nutritional Sciences, Saha Cardiovascular Research Center, Barnstable Brown Diabetes Center, University of Kentucky, Lexington, Kentucky 40536.
Lisa R Tannock, The Department of Internal Medicine, Saha Cardiovascular Research Center, Barnstable Brown Diabetes Center, University of Kentucky, Lexington, Kentucky 40536; Department of Veterans Affairs, Lexington, KY.
REFERENCES
- 1.Upchurch GR Jr. and Schaub TA. Abdominal aortic aneurysm. Am Fam Physician. 2006;73:1198–1204. [PubMed] [Google Scholar]
- 2.Lederle FA. Abdominal aortic aneurysm: still no pill. Ann Intern Med. 2013;159:852–853. [DOI] [PubMed] [Google Scholar]
- 3.Johnson BD, Kip KE, Marroquin OC, Ridker PM, Kelsey SF, Shaw LJ, Pepine CJ, Sharaf B, Bairey Merz CN, Sopko G, Olson MB, Reis SE, National Heart L and Blood I. Serum amyloid A as a predictor of coronary artery disease and cardiovascular outcome in women: the National Heart, Lung, and Blood Institute-Sponsored Women's Ischemia Syndrome Evaluation (WISE). Circulation. 2004;109:726–732. [DOI] [PubMed] [Google Scholar]
- 4.Nordon IM, Hinchliffe RJ, Loftus IM and Thompson MM. Pathophysiology and epidemiology of abdominal aortic aneurysms. Nat Rev Cardiol. 2011;8:92–102. [DOI] [PubMed] [Google Scholar]
- 5.Daugherty A and Powell JT. Recent highlights of ATVB: aneurysms. Arterioscler Thromb Vasc Biol. 2014;34:691–694. [DOI] [PubMed] [Google Scholar]
- 6.Davis FM, Rateri DL and Daugherty A. Mechanisms of aortic aneurysm formation: translating preclinical studies into clinical therapies. Heart. 2014;100:1498–1505. [DOI] [PubMed] [Google Scholar]
- 7.Agmon Y, Khandheria BK, Meissner I, Schwartz GL, Sicks JD, Fought AJ, O'Fallon WM, Wiebers DO and Tajik AJ. Is aortic dilatation an atherosclerosis-related process? Clinical, laboratory, and transesophageal echocardiographic correlates of thoracic aortic dimensions in the population with implications for thoracic aortic aneurysm formation. J Am Coll Cardiol. 2003;42:1076–1083. [DOI] [PubMed] [Google Scholar]
- 8.Alcorn HG, Wolfson SK Jr., Sutton-Tyrrell K, Kuller LH and O’Leary D. Risk factors for abdominal aortic aneurysms in older adults enrolled in The Cardiovascular Health Study. Arterioscler Thromb Vasc Biol. 1996;16:963–970. [DOI] [PubMed] [Google Scholar]
- 9.Wang L, Djousse L, Song Y, Akinkuolie AO, Matsumoto C, Manson JE, Gaziano JM and Sesso HD. Associations of Diabetes and Obesity with Risk of Abdominal Aortic Aneurysm in Men. J Obes. 2017;2017:3521649. [DOI] [PMC free article] [PubMed] [Google Scholar]
- 10.Police SB, Thatcher SE, Charnigo R, Daugherty A and Cassis LA. Obesity promotes inflammation in periaortic adipose tissue and angiotensin II-induced abdominal aortic aneurysm formation. Arterioscler Thromb Vasc Biol. 2009;29:1458–1464. [DOI] [PMC free article] [PubMed] [Google Scholar]
- 11.Lehman SJ, Massaro JM, Schlett CL, O'Donnell CJ, Hoffmann U and Fox CS. Peri-aortic fat, cardiovascular disease risk factors, and aortic calcification: the Framingham Heart Study. Atherosclerosis. 2010;210:656–661. [DOI] [PMC free article] [PubMed] [Google Scholar]
- 12.Aghamohammadzadeh R, Withers S, Lynch F, Greenstein A, Malik R and Heagerty A. Perivascular adipose tissue from human systemic and coronary vessels: the emergence of a new pharmacotherapeutic target. Br J Pharmacol. 2012;165:670–682. [DOI] [PMC free article] [PubMed] [Google Scholar]
- 13.Kim HW, Shi H, Winkler MA, Lee R and Weintraub NL. Perivascular Adipose Tissue and Vascular Perturbation/Atherosclerosis. Arterioscler Thromb Vasc Biol. 2020;40:2569–2576. [DOI] [PMC free article] [PubMed] [Google Scholar]
- 14.Daugherty A and Cassis L. Chronic angiotensin II infusion promotes atherogenesis in low density lipoprotein receptor −/− mice. Ann N Y Acad Sci. 1999;892:108–118. [DOI] [PubMed] [Google Scholar]
- 15.Daugherty A, Manning MW and Cassis LA. Angiotensin II promotes atherosclerotic lesions and aneurysms in apolipoprotein E-deficient mice. J Clin Invest. 2000;105:1605–1612. [DOI] [PMC free article] [PubMed] [Google Scholar]
- 16.Henriques T, Zhang X, Yiannikouris FB, Daugherty A and Cassis LA. Androgen increases AT1a receptor expression in abdominal aortas to promote angiotensin II-induced AAAs in apolipoprotein E-deficient mice. Arterioscler Thromb Vasc Biol. 2008;28:1251–1256. [DOI] [PMC free article] [PubMed] [Google Scholar]
- 17.Kugo H, Tanaka H, Moriyama T and Zaima N. Pathological Implication of Adipocytes in AAA Development and the Rupture. Ann Vasc Dis. 2018;11:159–168. [DOI] [PMC free article] [PubMed] [Google Scholar]
- 18.Leinonen E, Hurt-Camejo E, Wiklund O, Hulten LM, Hiukka A and Taskinen MR. Insulin resistance and adiposity correlate with acute-phase reaction and soluble cell adhesion molecules in type 2 diabetes. Atherosclerosis. 2003;166:387–394. [DOI] [PubMed] [Google Scholar]
- 19.Ebeling P, Teppo AM, Koistinen HA, Viikari J, Ronnemaa T, Nissen M, Bergkulla S, Salmela P, Saltevo J and Koivisto VA. Troglitazone reduces hyperglycaemia and selectively acute-phase serum proteins in patients with Type II diabetes. Diabetologia. 1999;42:1433–1438. [DOI] [PubMed] [Google Scholar]
- 20.Yang RZ, Lee MJ, Hu H, Pollin TI, Ryan AS, Nicklas BJ, Snitker S, Horenstein RB, Hull K, Goldberg NH, Goldberg AP, Shuldiner AR, Fried SK and Gong DW. Acute-phase serum amyloid A: an inflammatory adipokine and potential link between obesity and its metabolic complications. PLoS Med. 2006;3:e287. [DOI] [PMC free article] [PubMed] [Google Scholar]
- 21.Wong M, Toh L, Wilson A, Rowley K, Karschimkus C, Prior D, Romas E, Clemens L, Dragicevic G, Harianto H, Wicks I, McColl G, Best J and Jenkins A. Reduced arterial elasticity in rheumatoid arthritis and the relationship to vascular disease risk factors and inflammation. Arthritis Rheum. 2003;48:81–89. [DOI] [PubMed] [Google Scholar]
- 22.Tannock LR, De Beer MC, Ji A, Shridas P, Noffsinger VP, den Hartigh L, Chait A, De Beer FC and Webb NR. Serum amyloid A3 is a high density lipoprotein-associated acute-phase protein. J Lipid Res. 2018;59:339–347. [DOI] [PMC free article] [PubMed] [Google Scholar]
- 23.Kosuge M, Ebina T, Ishikawa T, Hibi K, Tsukahara K, Okuda J, Iwahashi N, Ozaki H, Yano H, Kusama I, Nakati T, Umemura S and Kimura K. Serum amyloid A is a better predictor of clinical outcomes than C-reactive protein in non-ST-segment elevation acute coronary syndromes. Circ J. 2007;71:186–190. [DOI] [PubMed] [Google Scholar]
- 24.Ogasawara K, Mashiba S, Wada Y, Sahara M, Uchida K, Aizawa T and Kodama T. A serum amyloid A and LDL complex as a new prognostic marker in stable coronary artery disease. Atherosclerosis. 2004;174:349–356. [DOI] [PubMed] [Google Scholar]
- 25.Ridker PM, Hennekens CH, Buring JE and Rifai N. C-reactive protein and other markers of inflammation in the prediction of cardiovascular disease in women. N Engl J Med. 2000;342:836–843. [DOI] [PubMed] [Google Scholar]
- 26.Poitou C, Viguerie N, Cancello R, De Matteis R, Cinti S, Stich V, Coussieu C, Gauthier E, Courtine M, Zucker JD, Barsh GS, Saris W, Bruneval P, Basdevant A, Langin D and Clement K. Serum amyloid A: production by human white adipocyte and regulation by obesity and nutrition. Diabetologia. 2005;48:519–528. [DOI] [PubMed] [Google Scholar]
- 27.Lee JY, Hall JA, Kroehling L, Wu L, Najar T, Nguyen HH, Lin WY, Yeung ST, Silva HM, Li D, Hine A, Loke P, Hudesman D, Martin JC, Kenigsberg E, Merad M, Khanna KM and Littman DR. Serum Amyloid A Proteins Induce Pathogenic Th17 Cells and Promote Inflammatory Disease. Cell. 2020;180:79–91 e16. [DOI] [PMC free article] [PubMed] [Google Scholar]
- 28.Thompson JC, Wilson PG, Shridas P, Ji A, de Beer M, de Beer FC, Webb NR and Tannock LR. Serum amyloid A3 is pro-atherogenic. Atherosclerosis. 2018;268:32–35. [DOI] [PMC free article] [PubMed] [Google Scholar]
- 29.Simons JP, Al-Shawi R, Ellmerich S, Speck I, Aslam S, Hutchinson WL, Mangione PP, Disterer P, Gilbertson JA, Hunt T, Millar DJ, Minogue S, Bodin K, Pepys MB and Hawkins PN. Pathogenetic mechanisms of amyloid A amyloidosis. Proc Natl Acad Sci U S A. 2013;110:16115–16120. [DOI] [PMC free article] [PubMed] [Google Scholar]
- 30.Wang QA, Tao C, Gupta RK and Scherer PE. Tracking adipogenesis during white adipose tissue development, expansion and regeneration. Nat Med. 2013;19:1338–1344. [DOI] [PMC free article] [PubMed] [Google Scholar]
- 31.Kent KC, Zwolak RM, Egorova NN, Riles TS, Manganaro A, Moskowitz AJ, Gelijns AC and Greco G. Analysis of risk factors for abdominal aortic aneurysm in a cohort of more than 3 million individuals. J Vasc Surg. 2010;52:539–548. [DOI] [PubMed] [Google Scholar]
- 32.Barisione C, Charnigo R, Howatt DA, Moorleghen JJ, Rateri DL and Daugherty A. Rapid dilation of the abdominal aorta during infusion of angiotensin II detected by noninvasive high-frequency ultrasonography. J Vasc Surg. 2006;44:372–376. [DOI] [PubMed] [Google Scholar]
- 33.Webb NR, De Beer MC, Wroblewski JM, Ji A, Bailey W, Shridas P, Charnigo RJ, Noffsinger VP, Witta J, Howatt DA, Balakrishnan A, Rateri DL, Daugherty A and De Beer FC. Deficiency of Endogenous Acute-Phase Serum Amyloid A Protects apoE−/− Mice From Angiotensin II-Induced Abdominal Aortic Aneurysm Formation. Arterioscler Thromb Vasc Biol. 2015;35:1156–1165. [DOI] [PMC free article] [PubMed] [Google Scholar]
- 34.Lu H, Rateri DL, Bruemmer D, Cassis LA and Daugherty A. Novel mechanisms of abdominal aortic aneurysms. Curr Atheroscler Rep. 2012;14:402–412. [DOI] [PMC free article] [PubMed] [Google Scholar]
- 35.Gu P and Xu A. Interplay between adipose tissue and blood vessels in obesity and vascular dysfunction. Rev Endocr Metab Disord. 2013;14:49–58. [DOI] [PubMed] [Google Scholar]
- 36.Weisberg SP, Hunter D, Huber R, Lemieux J, Slaymaker S, Vaddi K, Charo I, Leibel RL and Ferrante AW Jr. CCR2 modulates inflammatory and metabolic effects of high-fat feeding. J Clin Invest. 2006;116:115–124. [DOI] [PMC free article] [PubMed] [Google Scholar]
- 37.Weisberg SP, McCann D, Desai M, Rosenbaum M, Leibel RL and Ferrante AW Jr. Obesity is associated with macrophage accumulation in adipose tissue. J Clin Invest. 2003;112:1796–1808. [DOI] [PMC free article] [PubMed] [Google Scholar]
- 38.Xu H, Barnes GT, Yang Q, Tan G, Yang D, Chou CJ, Sole J, Nichols A, Ross JS, Tartaglia LA and Chen H. Chronic inflammation in fat plays a crucial role in the development of obesity-related insulin resistance. J Clin Invest. 2003;112:1821–1830. [DOI] [PMC free article] [PubMed] [Google Scholar]
- 39.Vela D, Buja LM, Madjid M, Burke A, Naghavi M, Willerson JT, Casscells SW and Litovsky S. The role of periadventitial fat in atherosclerosis. Arch Pathol Lab Med. 2007;131:481–487. [DOI] [PubMed] [Google Scholar]
- 40.Henrichot E, Juge-Aubry CE, Pernin A, Pache JC, Velebit V, Dayer JM, Meda P, Chizzolini C and Meier CA. Production of chemokines by perivascular adipose tissue: a role in the pathogenesis of atherosclerosis? Arterioscler Thromb Vasc Biol. 2005;25:2594–2599. [DOI] [PubMed] [Google Scholar]
- 41.Lee HY, Kim SD, Shim JW, Lee SY, Lee H, Cho KH, Yun J and Bae YS. Serum amyloid A induces CCL2 production via formyl peptide receptor-like 1-mediated signaling in human monocytes. J Immunol. 2008;181:4332–4339. [DOI] [PubMed] [Google Scholar]
- 42.Song C, Hsu K, Yamen E, Yan W, Fock J, Witting PK, Geczy CL and Freedman SB. Serum amyloid A induction of cytokines in monocytes/macrophages and lymphocytes. Atherosclerosis. 2009;207:374–383. [DOI] [PubMed] [Google Scholar]
- 43.Connolly M, Mullan RH, McCormick J, Matthews C, Sullivan O, Kennedy A, FitzGerald O, Poole AR, Bresnihan B, Veale DJ and Fearon U. Acute-phase serum amyloid A regulates tumor necrosis factor alpha and matrix turnover and predicts disease progression in patients with inflammatory arthritis before and after biologic therapy. Arthritis Rheum. 2012;64:1035–1045. [DOI] [PubMed] [Google Scholar]
- 44.Mullan RH, Bresnihan B, Golden-Mason L, Markham T, O'Hara R, FitzGerald O, Veale DJ and Fearon U. Acute-phase serum amyloid A stimulation of angiogenesis, leukocyte recruitment, and matrix degradation in rheumatoid arthritis through an NF-kappaB-dependent signal transduction pathway. Arthritis Rheum. 2006;54:105–114. [DOI] [PubMed] [Google Scholar]
- 45.Fruhbeck G, Catalan V, Rodriguez A, Ramirez B, Becerril S, Salvador J, Portincasa P, Colina I and Gomez-Ambrosi J. Involvement of the leptin-adiponectin axis in inflammation and oxidative stress in the metabolic syndrome. Sci Rep. 2017;7:6619. [DOI] [PMC free article] [PubMed] [Google Scholar]
- 46.Matsui S, Yamane T, Kobayashi-Hattori K and Oishi Y. Ultraviolet B irradiation reduces the expression of adiponectin in ovarial adipose tissues through endocrine actions of calcitonin gene-related peptide-induced serum amyloid A. PLoS One. 2014;9:e98040. [DOI] [PMC free article] [PubMed] [Google Scholar]
- 47.Yoshida S, Fuster JJ and Walsh K. Adiponectin attenuates abdominal aortic aneurysm formation in hyperlipidemic mice. Atherosclerosis. 2014;235:339–346. [DOI] [PMC free article] [PubMed] [Google Scholar]
Associated Data
This section collects any data citations, data availability statements, or supplementary materials included in this article.