
Figure 10. Extensive mitochondrial networks in astrocyte soma, branch, branchlet, reflexive, and endfeet processes.
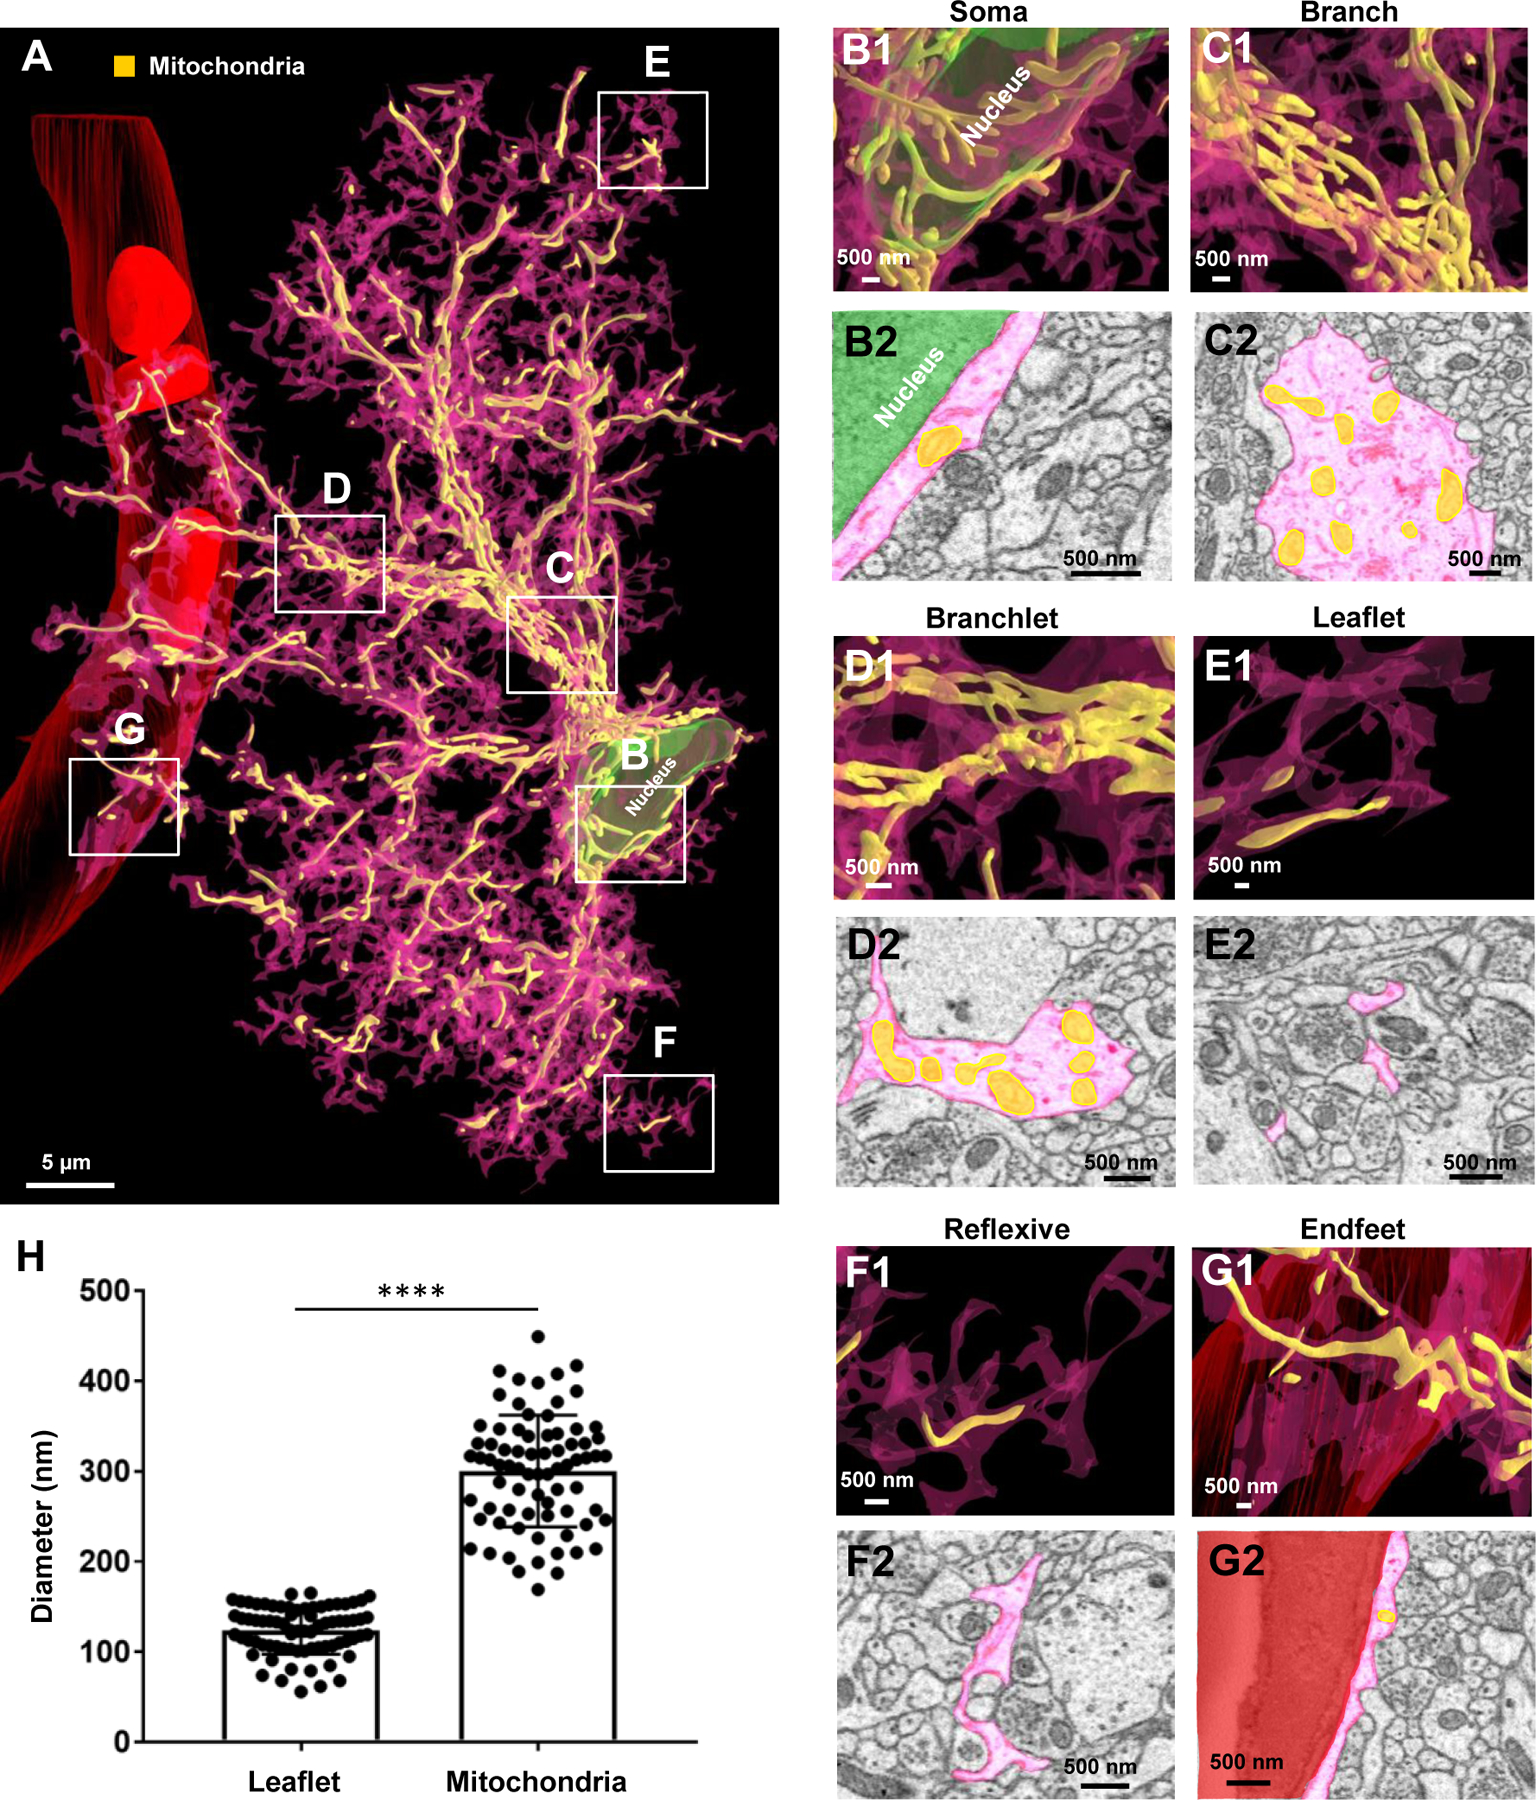
A) 3D reconstruction of an entire astrocyte (pink) and its internal mitochondria (yellow). Note that the white, boxed areas in A approximate the locations of magnified images in B-G. B1) Magnified 3D reconstruction of mitochondria found within the astrocyte soma. B2) 2D EM trace of mitochondria within the astrocyte soma. Note that the astrocyte nucleus is depicted in green in both the 2D and 3D images. C1) 3D reconstruction and 2D trace (C2) of mitochondria within an astrocyte branch. D1) 3D reconstruction and 2D trace (D2) of mitochondria within astrocyte branchlets. E1) 3D reconstruction and 2D trace (E2) of mitochondria within astrocyte leaflets. F1) 3D reconstruction and 2D trace (F2) of mitochondria within reflexive astrocyte processes. G1) 3D reconstruction and 2D trace (G2) of mitochondria within an astrocyte endfoot adjacent to the blood vessel (red). H) Graphical representation depicting the average diameter of leaflet astrocyte processes, relative to the diameter of mitochondria. Each dot is indicative of the diameter of one leaflet process or one mitochondria. The diameter of 25 leaflet processes and 25 mitochondria were measured for each of the three astrocytes. ****: p < 0.0001; student’s t-test.