Fig. 6.
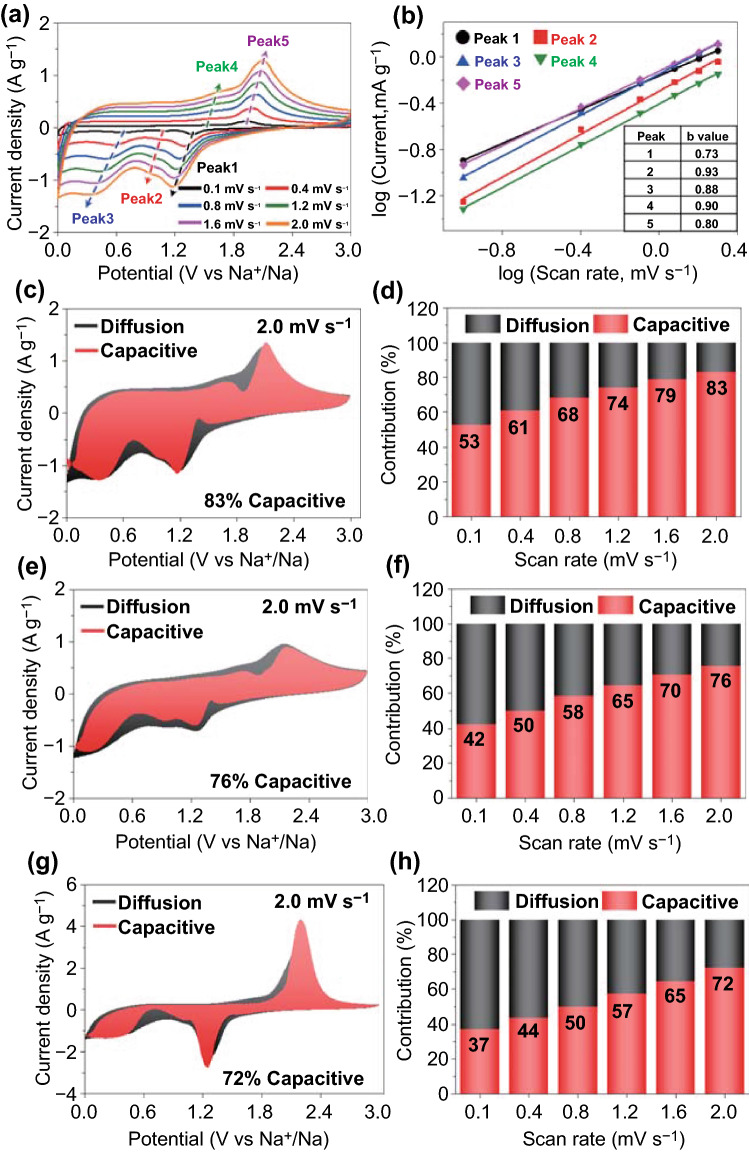
Electrochemical reaction dynamics analysis of a–d the P-CoSe2@PDA-C NR, e, f P-CoSe2 @NGC NR, and g, h bare CoSe2 hollow microspheres: a CV curves obtained at various scan rates, b current response (i) versus scan rate (n) at each redox peak, c, e, g CV curves with the capacitive fraction shown by the red region at a scan rate of 2.0 mV s−1, and d, f, h bar charts showing the percentage of the capacitive contribution at different scan rates

