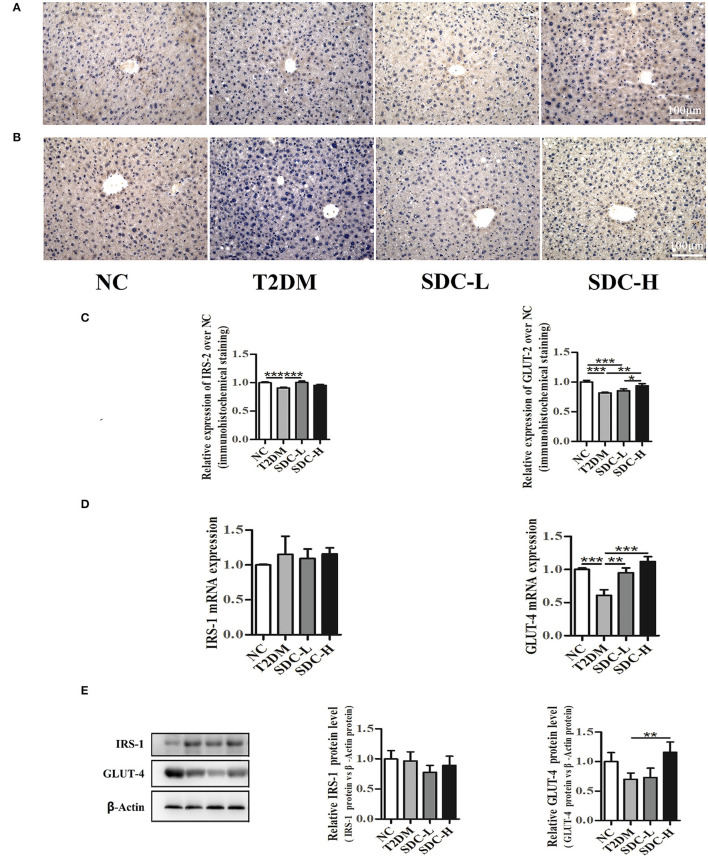
Figure 5.
Immunohistochemistry analysis of IRS-2 (A) and GLUT-2 (B) in liver tissues, n = 5; Relative expression of IRS-2 and GLUT-2 in liver tissues, n = 5 (C); mRNA levels of IRS-1 and GLUT-4 in skeletal muscle tissues, n = 8 (D); protein levels of IRS-1 and GLUT-4 in skeletal muscle tissues, n = 6 (E). *P < 0.05, **P < 0.01, ***P < 0.001.

