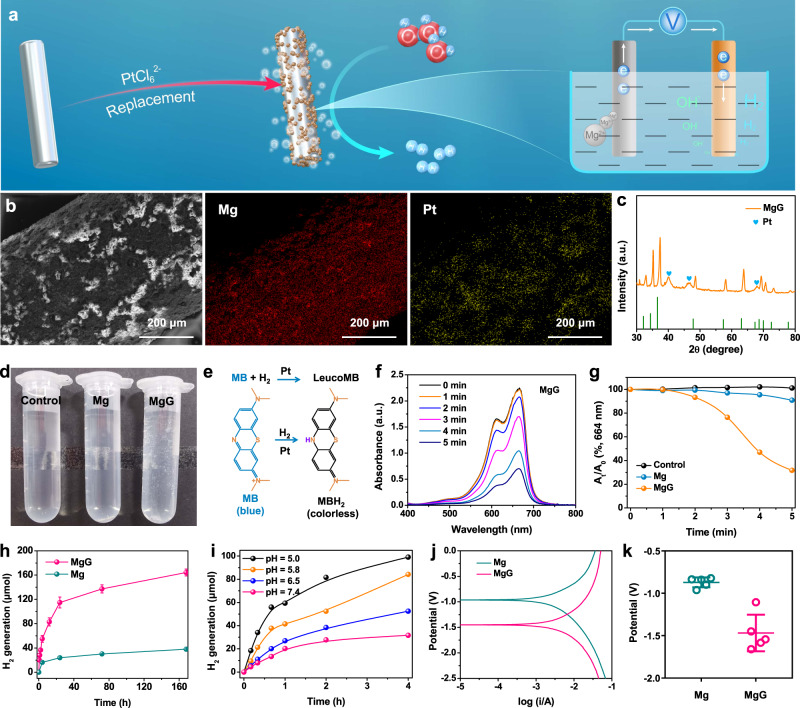
Fig. 2. Preparation and characterization of MgG rods.
a Schematic illustration of the synthesis process of Mg galvanic cells and the H2 production mechanism. b The representative SEM image and EDS element mapping of MgG rods from three independent samples. c The XRD patterns of MgG rods. d Photograph showing H2 generation in PBS from Mg and MgG. e Schematic illustration of H2 generation detected by the MB probe. f Time-dependent absorption spectra of the MB solution (pH = 6.5) with MgG rods added. g Comparison of MB reduction by Mg rods and MgG rods. h Time-dependent H2 generation measured by gas chromatography from Mg or MgG rods in PBS (pH = 6.5, n = 3 biologically independent samples). i H2 generation profiles of MgG rods in PBS solutions with different pH values measured by gas chromatography. j The Tafel curve of Mg rods and MgG rods. k The corrosion potentials of Mg rods and MgG rods (n = 5 biologically independent samples). Data are presented as mean values ± SD.

