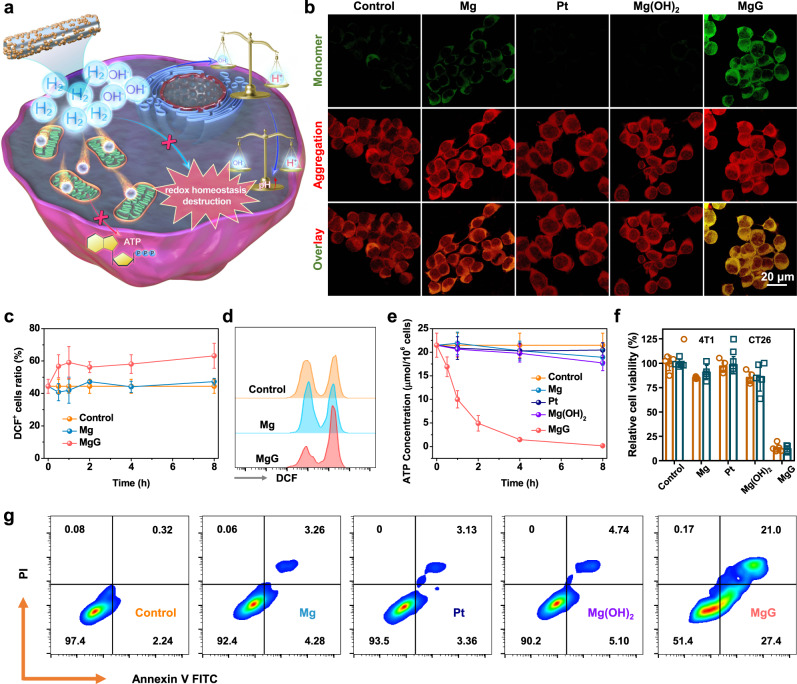
Fig. 3. In vitro hydrogen therapy with MgG rods.
a Schematic illustration showing the mechanims of hydrogen therapy with MgG for cancer cell killing. b Detection of mitochondria membrane potentials by confocal fluorescence images of 4T1 cells stained with JC-1 dye. c Time-dependent changes of intracellular ROS in 4T1 cells during different treatments (n = 5 biologically independent samples). d Flow cytometry data to show DCF-positive 4T1 cells after different treatments. e Time-dependent changes of intracellular ATP contents in 4T1 cells during different treatments (n = 5 biologically independent samples). f Relative viabilities of 4T1 and CT26 cells after various treatments (control, Mg, Pt, Mg(OH)2, and MgG, n = 5 biologically independent samples). g Flow cytometry analysis of 4T1 cells after various treatments using an Annexin V-FITC/PI kit. A representative image of three biologically independent samples from each group is shown in (b). Data are presented as mean values ± SD.

