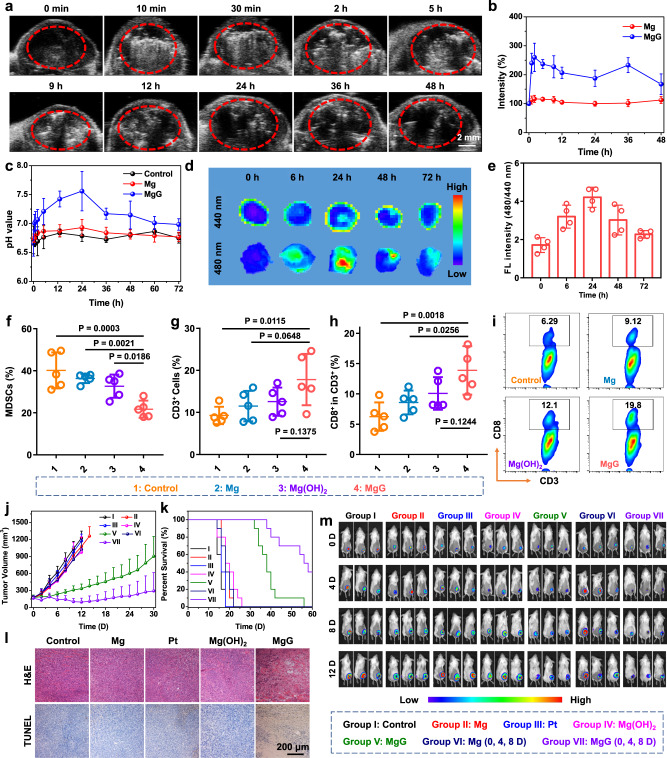
Fig. 4. In vivo hydrogen therapy with MgG rods.
a In vivo time-dependent ultrasonic imaging of 4T1 tumor-bearing mice after intratumoral implantation with MgG rods. b Quantitative analysis of signal intensities based on ultrasonic imaging data. c Time-dependent pH value changes of tumors in mice post intratumoral implantation with Mg rods or MgG rods. d Ex vivo fluorescence images of tumors after implantation of MgG for different periods of time. e Tumor fluorescence (FL) signal ratios (480/440) based on ex vivo fluorescence imaging data in (C). f–h The quantification results of MDSCs (CD45+CD11b+Gr-1+, f), T cells (CD3+, g), CD8+ T cells (CD3+CD8+, h) by flow cytometry on day 6 post-MgG implantation. i The flow cytometric analysis results of CD8+ T cells (CD3+CD8+) within the tumors after different treatments. j The growth curves of tumors after various treatments. k Survival rates of tumor-bearing mice after various treatments. l Microscopy images of H&E and TUNEL stained tumor slices collected from mice post different treatment groups. m In vivo bioluminescence images of mice bearing subcutaneous 4T1 tumors expressing firefly luciferase (Luc-4T1) to display the therapeutic efficacy of mice after various treatments. n = 3 biologically independent animals in (b, c). n = 4 biologically independent animals in (e). n = 5 biologically independent animals in (f–h). n = 10 biologically independent animals in (j). A representative image of three biologically independent animals from each group is shown in (a, l). Data are presented as mean values ± SD. P values calculated by the two-tailed student’s t test are indicated in the Figures.

