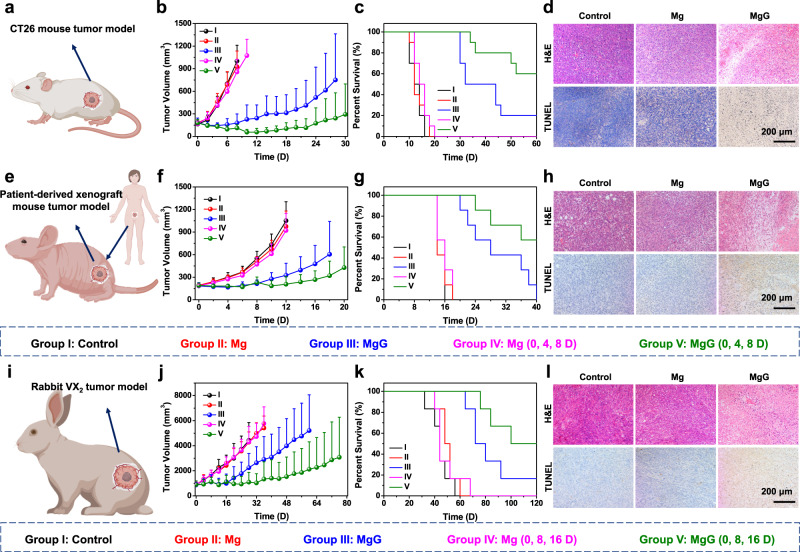
Fig. 5. In vivo hydrogen therapy of different tumor models vith MgG rods.
a Scheme of the subcutaneous CT26 mouse tumor model for MgG-based hydrogen therapy. b, c Tumor growth curves (b) and survival rates (c) of CT26 tumor-bearing mice after different treatments as indicated. d Microscopy images of H&E and TUNEL stained CT26 tumor slices collected from different groups. e Scheme of the PDX tumor model in mice for MgG-based hydrogen therapy. f, g Tumor growth curves (f) and survival rates (g) of nude mice after different treatments. h Microscopy images of H&E and TUNEL stained PDX tumor slices collected from different groups. i Scheme of the VX2 liver rabbit tumor model for MgG-based hydrogen therapy. j, k Tumor growth curves (j) and survival rates (k) of rabbits after different treatments. l Microscopy images of H&E and TUNEL stained VX2 tumor slices collected from different groups. n = 10 biologically independent animals in (b). n = 7 biologically independent animals in (f). n = 6 biologically independent animals in (j). A representative image of three biologically independent animals from each group is shown in (d, h, l). Data are presented as mean values ± SD.

