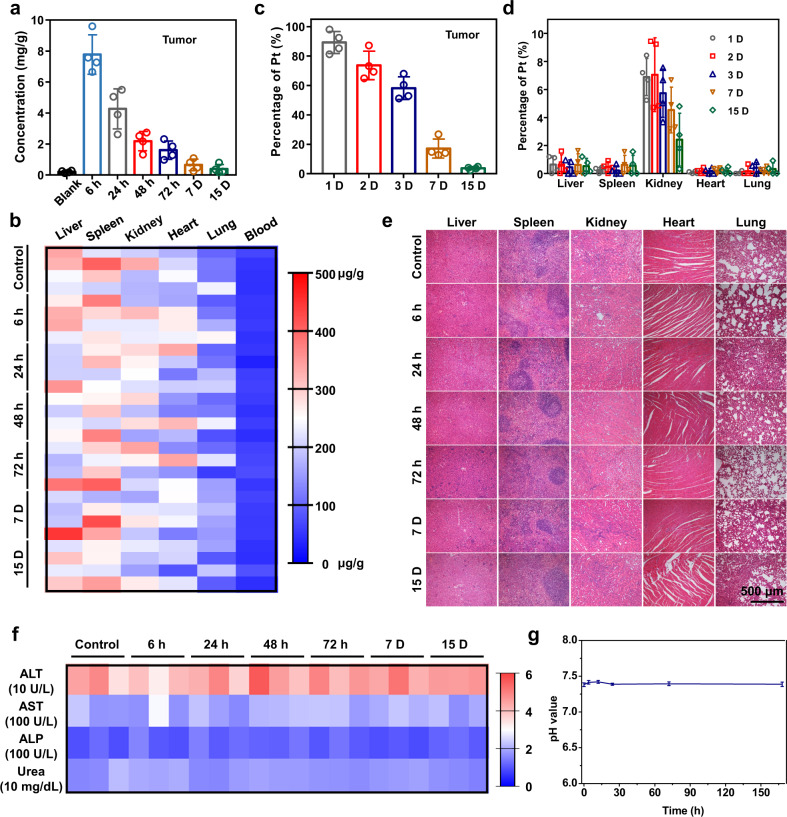
Fig. 6. In vivo safety and biodegradation behaviors of MgG rods.
a The Mg levels in tumors of mice after being implanted with MgG rods for different periods of time. b The Mg levels in major organs and blood of mice after being implanted with MgG rods for different periods of time. The Mg contents were measured by ICP-OES. No notable variation of Mg levels was found in the blood or organs of implanted mice compared to the control. c The Pt levels in tumors of mice after being implanted with MgG rods for different periods of time (1, 2, 3, 7, and 15 D). d The Pt levels in major organs of mice after being implanted with MgG rods for different periods of time (1, 2, 3, 7, and 15 D). e Hematoxylin and eosin (H&E) staining of mouse major organs (liver, spleen, kidney, heart, and lung) to examine the histological changes after implantation of MgG rods in mice. f Blood biochemistry data of Balb/c mice after being implanted with MgG rods for different periods of time (0, 6 h, 24 h, 48 h, 72 h, 7 days, and 15 days). The measured indexes included alanine aminotransferase (ALT), aspartate aminotransferase (AST), alkaline phosphatase (ALP), and blood urea. g Blood pH value variation of Balb/c mice after being implanted with MgG rods for different periods of time (0, 4 h, 12 h, 24 h, 72 h, and 7 days). n = 4 biologically independent animals in (a, c–d). n = 3 biologically independent animals in (g). A representative image of three biologically independent animals from each group is shown in (e). Data are presented as mean values ± SD.

