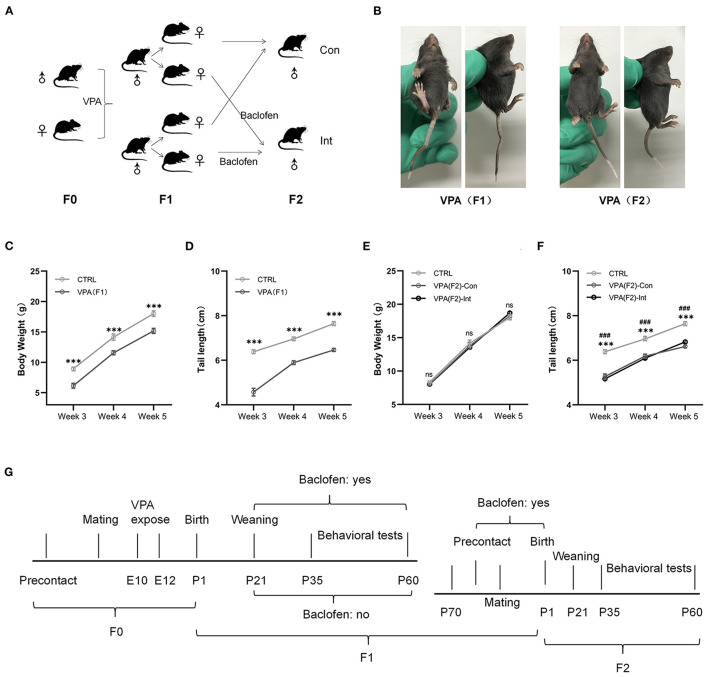
Figure 1.
F1 mice exhibited delayed growth and tail malformations, and F2 mice exhibited delayed tail growth without malformation. (A) The schematic diagram of F1 and F2 mice breeding. (B) The pictures of F1 mice show a tail deformity, and F2 mice did not show any tail deformity. (C,D) The body weight and tail length of male F1 mice were lower than those of male control mice from postnatal week 3–week 5 [two-way analysis of variance (ANOVA) followed by Bonferroni post-hoc test, n (CTRL vs. F1) = 14:14, ***p < 0.001]. (E,F) Compared to CTRL group mice, male F2-Con (without prenatal baclofen intervention) and male F2-Int (with prenatal baclofen intervention) mice did not show a significant difference in body weight, but the tail length of F2-Con and F2-Int mice was lower than that of male CTRL group mice in postnatal week 3–week 5 [two-way analysis of variance (ANOVA) followed by Bonferroni post-hoc test, n (CTRL vs. F2-Con vs. F2-Int) = 14:12:13, ***p < 0.001]. All data for all figures are plotted as the mean ± SEM. (G) A representative timeline of the experimental process. E: embryonic day; P: postnatal day; F0: CTRL mice; F1: first-generation mice (VPA-exposed mice); F2: second-generation mice (offspring of VPA-exposed mice); F1-Con: F1 mice with no oral baclofen treatment; F1-Int: F1 mice with oral baclofen treatment; F2-Con: F2 mice with no prenatal baclofen treatment; F2-Int: F2 mice with prenatal baclofen treatment; # indicates a comparison between the CTRL group and F2-Con groups; * indicates a comparison between the control (CTRL) group and F2-Int groups.

