Figure 4.
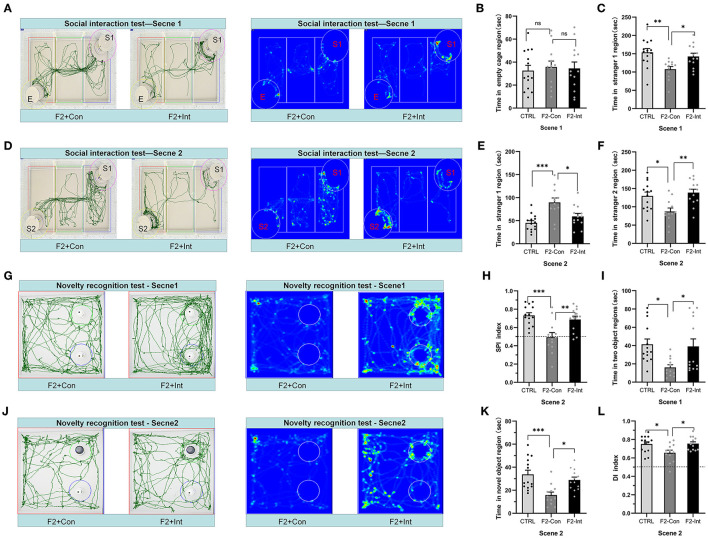
Prenatal baclofen administration corrected social interaction deficits and novelty recognition deficits in F2 mice in the social interaction test. (A,D) In the social interaction test, representative traces and heatmaps from tested mice in the sociability phase (scene 1) and preference for social novelty phase (scene 2). (B) The time that tested mice entered the region of empty cage for sniffing in scene 1 of the social interaction test. (C) The time that tested mice entered the region containing stranger 1 for sniffing in scene 1 of the social interaction test. (E) The time that tested mice entered the region containing stranger 1 for sniffing in scene 2 of the social interaction test. (F) The time that tested mice entered the region containing stranger 2 for sniffing in scene 2 of the social interaction test. (G,J) Representative traces of tested mice in the novel object recognition task. (G) Traces and heatmaps of mice exploring the regions containing the two similar objects (white plastic bottles) in phase 1 (scene 1). (H) The SPI of tested mice in scene 2 of the social interaction test. (I) The total time spent sniffing the two objects by each group of mice in scene 1 of the novel object recognition task. (J) Traces and heatmaps of mice exploring the region containing the novel object (black glass bottle) in phase 2 (scene 2) of the novel object recognition task. This test was used to assess novelty recognition ability. (K) The time spent sniffing the novel object by each group of mice in scene 2 of the novel object recognition task. (L) The discrimination index (DI) for each group of mice in scene 2 of the novel object recognition task. (B,C,E,F,H,I,K,L) One-way ANOVA followed by the Bonferroni post hoc test was used to compare the differences among groups: *p < 0.05, **p < 0.01, ***p < 0.001. All data for all figures are plotted as the mean ± SEM. n (CTRL: F2-Con: F2-Int) = 14:12:13.

