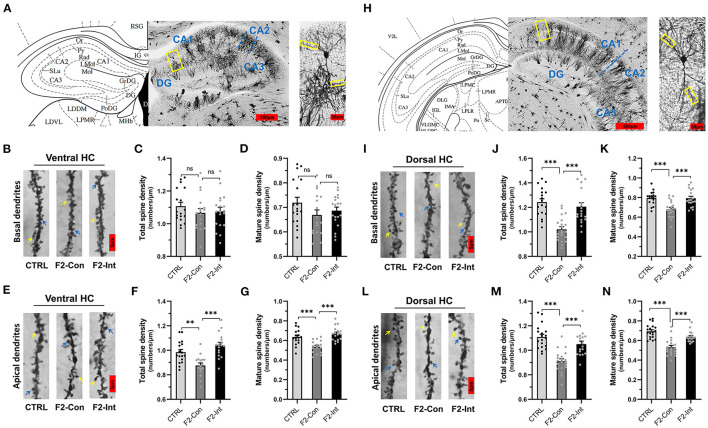
Figure 6.
Prenatal baclofen administration corrected the defects in dendritic spines density of CA1 pyramidal neurons in the HC in F2 mice. (A) A composite of a representative scanned image of Golgi-Cox-stained slices of the ventral HC and the mouse brain map from The Mouse Brain in Stereotaxic Coordinates; scale bar: 300 and 30 μm. (A/H) The part inside the yellow rectangle is the neurons and dendrites selected for analysis. The spines were selected from grade 3 basal dendrites and grade 6/7 apical dendrites for analysis. (B/E) Representative three-dimensional reconstructed images of the basal/apical dendrites of pyramidal neurons in the CA1 of the ventral HC obtained from CTRL, F2-Con and F2-Int mice. The yellow arrow points to a mushroom spine, and the blue arrow points to a stubby spine. Scale bar: 5 μm. (C,D) Summary of spine density on the basal dendrites of CA1 pyramidal neurons in the ventral HC. Mature spines = mushroom spines + stubby spines (CTRL: n = 18 dendrites from 3 mice; F2-Con: n = 17 dendrites from 3 mice; F2-Int: n = 19 dendrites from 3 mice). (F,G) Summary of spine density on the apical dendrites of CA1 pyramidal neurons in the ventral HC. Mature spines = mushroom spines + stubby spines (CTRL: n = 17 dendrites from 3 mice; F2-Con: n = 16 dendrites from 3 mice; F2-Int: n = 17 dendrites from 3 mice). (H) A composite of a representative scanned image of Golgi-Cox-stained slices of the dorsal HC and the mouse brain map from The Mouse Brain in Stereotaxic Coordinates; scale bar: 500 and 30 μm. (I/L) Representative three-dimensional reconstructed images of the basal/apical dendrites of pyramidal neurons in the CA1 of the dorsal HC. The yellow arrow points to the mushroom spine, and the blue arrow points to the stubby spine. Scale bar: 5 μm. (J,K) Summary of spine density on the basal dendrites of CA1 pyramidal neurons in the HC (CTRL: n = 18 dendrites from 3 mice; F2-Con: n = 21 dendrites from 3 mice; F2-Int: n = 19 dendrites from 3 mice). (M,N) Summary of spine density on the apical dendrites of CA1 dorsal neurons in the dorsal HC. Mature spines = mushroom spines + stubby spines (CTRL: n = 19 dendrites from 3 mice; F2-Con: n =20 dendrites from 3 mice; F2-Int: n = 17 dendrites from 3 mice). One-way ANOVA followed by the Bonferroni post-hoc test was used to compare the differences among the four groups; *p < 0.05, **p < 0.01, ***p < 0.001. All data for all figures are plotted as the mean ± SEM.

