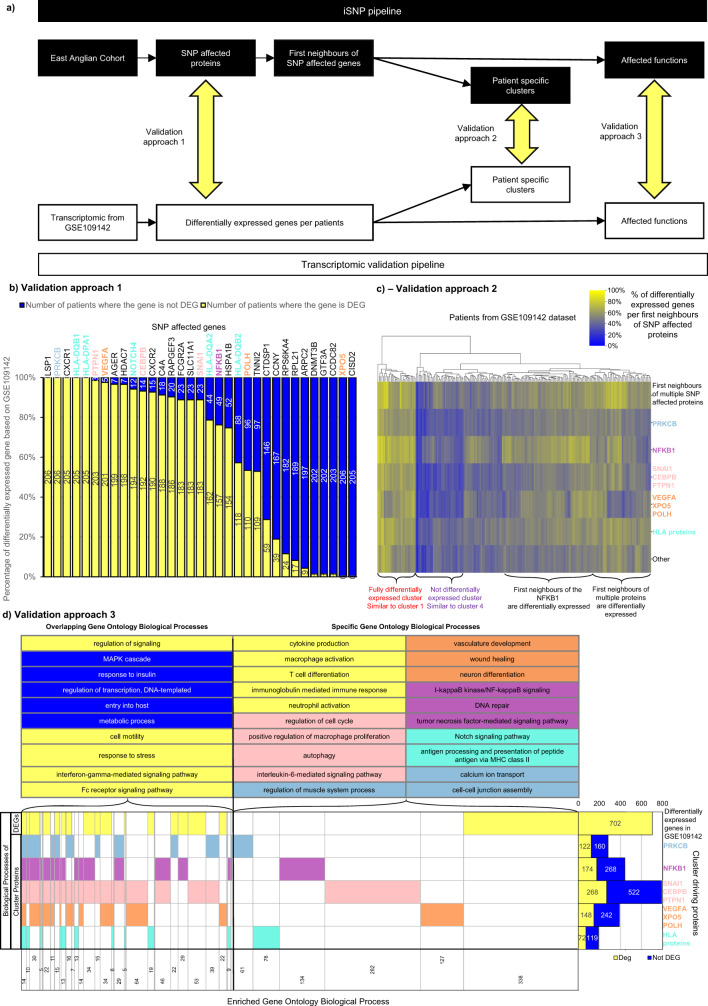
Fig. 4. Validation of the iSNP method with transcriptomic data from an independent cohort of ulcerative colitis patients.
a Flow chart depicting the validation approaches. b Single nucleotide polymorphism (SNP) affected genes differentially expressed in ulcerative colitis (UC) patients from biopsy samples of the GSE109142 dataset. Absolute log2 fold change > 1 was used as a cut-off. c The percentage of differentially expressed genes from the first neighbours of the cluster-driving proteins using the same dataset. Analysis of the patients in the independent cohort produced two clusters similar to those generated by iSNP (red and purple cluster on Fig. 3B). The most differentially expressed genes from the UC-associated signalling network in the validation cohort were the first neighbours of multiple SNP-affected proteins. d Similarities between the over-represented Gene Ontology Biological Processes between first neighbours of cluster-driving proteins and differentially expressed genes. Gene Ontology terms were considered enriched based on a Benjamini-Hochberg corrected hypergeometric test p < 0.05. A gene was considered differentially expressed based on |FC| > 1 and q < 0.05 Benjamini-Hochberg corrected moderate t-test There are two main groups of Gene Ontology Biological Processes: common and specific. The common processes include regulation of signalling or metabolic processes while the specific processes represent the cluster-driving protein and its cluster function or the transcriptomic effect of inflammation. Differentially expressed genes, first neighbours, or functions are represented in yellow and the cluster-driving genes are represented by their respective colours: pink—SNAI1, CEBPB, PTPN1; blue—PRKCB; orange—VEGFA, XPO5, POLH; purple—NFKB1, turquoise—HLA proteins.

