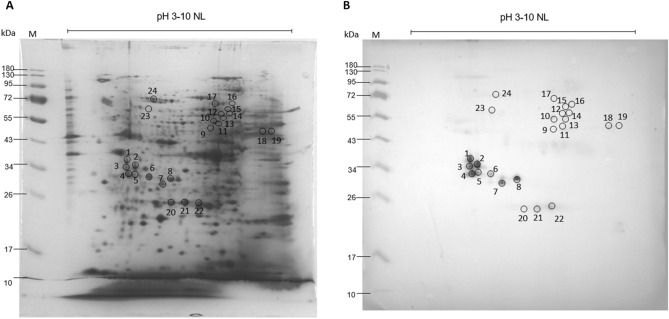
Figure 5.
Images of protein from crude extract of aL3Gs subjected to two-dimensional electrophoresis (2-DE). Using IEF, the proteins are separated on a linear pH range of 3–10 in the first dimension and followed by 12% SDS-PAGE for the second dimension. The gel on the left is stained with Coomassie blue (A). The right side shows the nitrocellulose membrane with proteins electro-transferred from the gel and then probed with pooled sera from patients diagnosed with gnathostomiasis (B). Numbers at the left of each image indicate protein molecular weight (MW) markers.

