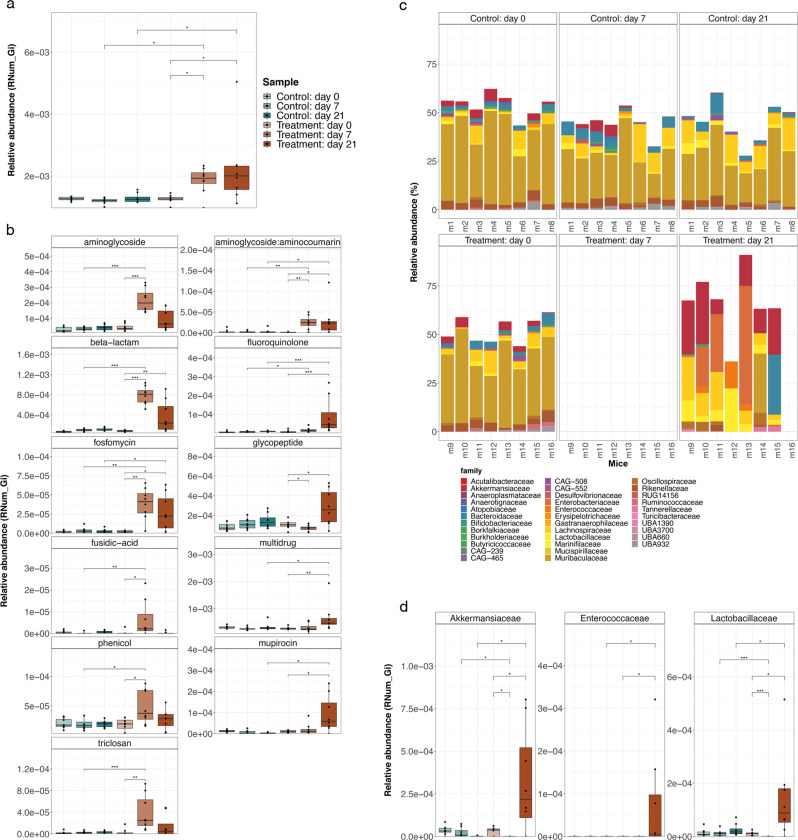
Fig. 2. Resistome in antibiotic-treated mice.
a Overall ARG relative abundance levels are shown for each group (n = 8 biological replicates). *represents significance with an adjusted p-value less than 0.05 as assessed using a Wilcoxon rank-sum test. The center line denotes the median value (50th percentile), while the outer lines of the box represent the 25th to 75th percentiles. The black whiskers mark the 5th and 95th percentiles. b Significantly differentially abundant AMR categories found to be enriched in the mice treated with antibiotics compared across different timepoints, i.e., day 0, day 7, and day 21, *adjusted p-value < 0.05 (Wilcoxon rank-sum test). n = 8, biological replicates per group. The center line denotes the median value (50th percentile), while the outer lines of the box represent the 25th–75th percentiles. The black whiskers mark the 5th and 95th percentiles. c Barplots showing the relative abundance of MAGs (Family level) associated with ARGs in each sample. d Relative abundance of ARGs associated with Akkermansiaceae, Enterococcaceae, and Lactobacillaceae in the control and treated mice (n = 8 biological replicates per group). *adjusted p-value < 0.05 (Wilcoxon rank-sum test). The center line denotes the median value (50th percentile), while the outer lines of the box represent the 25th–75th percentiles. The black whiskers mark the 5th and 95th percentiles. Significance for all analyses was assessed using a two-sided Wilcoxon rank sum test, where, p-values are indicated by *, i.e., * < 0.05, ** < 0.01, *** < 0.001. Source data are provided as a Source Data file.

