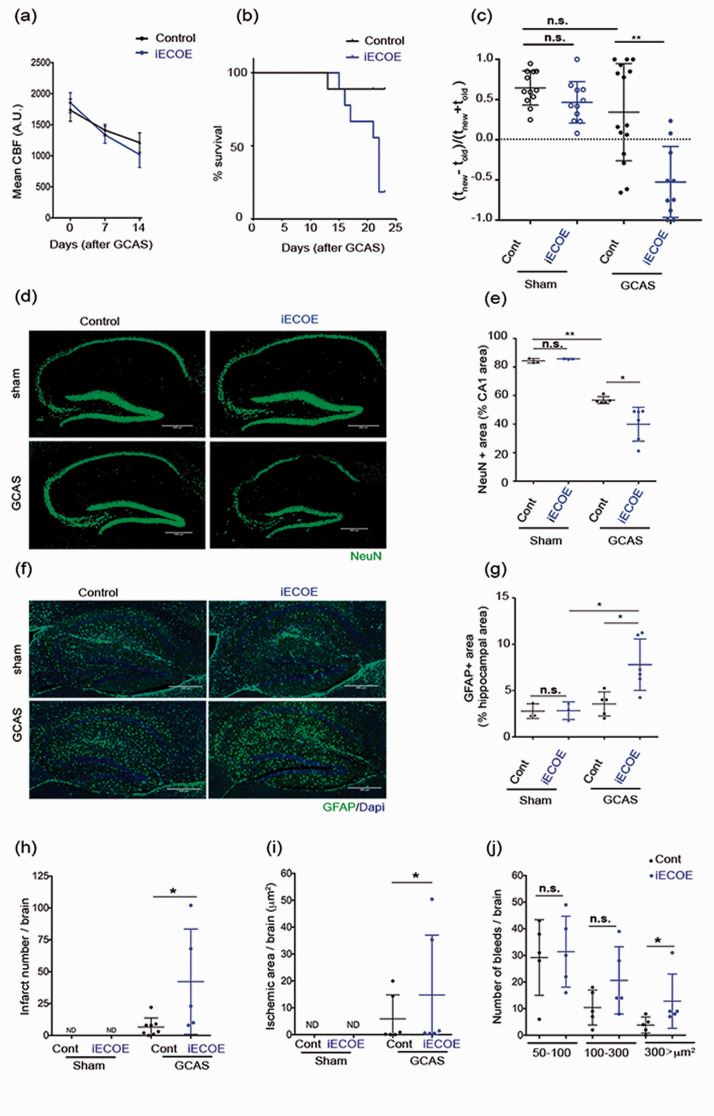
Figure 2.
Endothelial overexpression of Pdzrn3 enhances cognitive defects and brain damage after gradual carotid artery stenosis (GCAS). (a) Cerebral blood flow (CBF) decreases gradually in all groups (Control, Pdzrn3 iECOE mice) after implantation of ameroid constrictors (GCAS). Two groups were not significantly different in 2-way repeated-measures ANOVA from day 0 to day 14. (n = 10 per group). (b) Kaplan-Meier curve showing survival rate of control and Pdzrn3 iECOE (IECOE) mice before and until 21 days after GCAS (n = 10 per group). (c) Y-maze exploration test: evaluation of cognitive performance in Pdzrn3 iECOE mice before (sham) and at 7 days after GCAS showing that endothelial Pdzrn3 overexpression worsened the test. Data are represented as individual values plus means ± SD. Significance was assessed by 2-way ANOVA. Each group contained 11–15 mice and each mouse is indicated as a dot in graphs. (d) Representative hippocampal immunofluorescent staining for NeuN before (Sham) and after GCAS at 21 days in control and iECOE mice. (e) NeuN+ cells were quantified as a percentage of the area occupied in the CA1 area non-operated (sham) and after GCAS from iECOE vs their respective control littermate mice. (f) Representative hippocampal immunohistochemical staining for GFAP before (Sham) and at 21 days after GCAS in control (Cont) and iECOE mice. (g) GFAP were quantified in hippocampal area before and after GCAS in iECOE mice versus their respective control littermates. Data shown in the graphs are obtained in sham condition, from 3 mice per group and in GCAS condition from n = 6 iECOE vs n = 5 control mice; data for four brain slices per mouse were recorded and averaged to produce a single value for each mouse. One-way ANOVA was performed. Data are represented as individual values plus means ± SD. Infarct number (n = 8 iECOE vs n = 5 control) (h), ischemic area (n = 6 per group) (i) and bleed number (n = 5 per group) (j) were quantified in brains from either non operated (sham) or after 21 days of GCAS from control vs iECOE mice. Data for eight brain slices per mouse were recorded and averaged to produce a single value for each mouse. One-way ANOVA was performed. Data are represented as individual values plus means ± SD.

