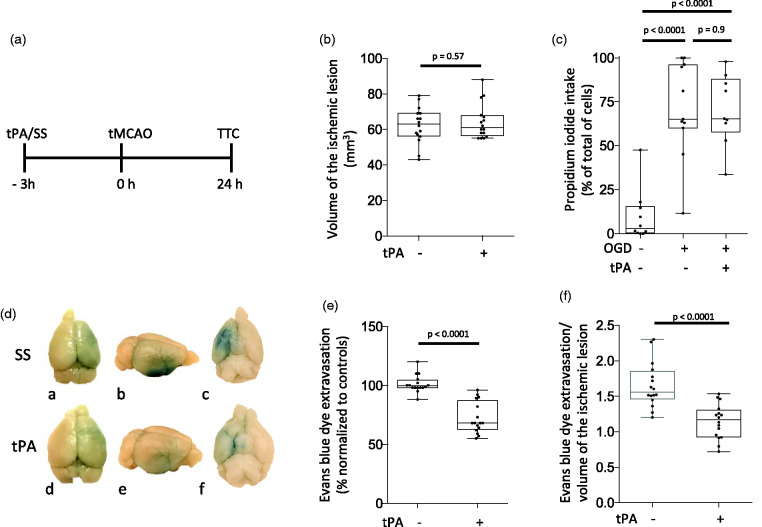
Figure 1.
Effect of preconditioning with tPA. A. Diagram of the experimental paradigm used to study the effect of preconditioning with tPA (SS: saline solution SS. TTC: 2,3,5-triphenyltetrazolium chloride). B. Male C57BL/6J mice were intravenously treated with either SS or tPA (n = 16 per group) three hours before 60 minutes of tMCAO. The volume of the ischemic lesion was measured in TTC-stained sections 24 hours later. Statistical analysis: two-tailed student’s t-test. C. Cerebral cortical neurons from male C57BL/6J mice were treated with 5 nM of tPA or PBS three hours before exposure to 60 minutes of oxygen and glucose deprivation (OGD) conditions. Cells were fixed 24 hours later to quantify the uptake of propidium iodide (PPI). Values are given as percentage of PPI-positive cells in relation to the total number of cells. n = 10 per experimental group with cells from three different cultures. Statistical analysis: one-way ANOVA with Holm-Sidaks multiple comparisons test. D. Representative photographs of the dorsal (a & d), lateral (b & e) and ventral (c & f) surface of the brain of male C57BL/6J mice injected with Evans blue dye 24 hours after 60 minutes of tMCAO performed 3 hours after the intravenous administration of either saline solution (SS; a–c), or tPA (tPA; d–f). Blue denotes areas with Evans blue dye extravasation in the ischemic hemisphere. E. Quantification of Evans blue dye extravasation in the ischemic hemisphere of mice preconditioned with tPA three hours before tMCAO, compared with Evans blue dye extravasation in the contralateral hemisphere, and normalized to Evans blue dye extravasation in mice pretreated with SS three hours before the ischemic injury. n = 16 mice per experimental group. Statistical analysis: two-tailed student’s t-test. F. Evans blue dye extravasation/stroke volume ratio in animals exposed to the experimental conditions described in D & E. n = 16 per experimental group. Statistical analysis: two-tailed student’s t-test.

